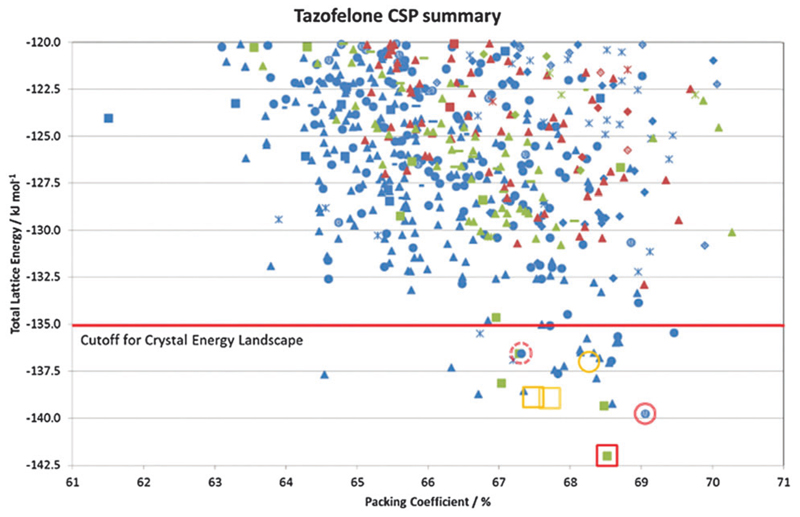
Fig. 3.
Summary of the CSP study of tazofelone adapted from ref. 19. Each point represents a lattice energy minimum, with structures categorised by colour to denote the type of conformation (AB extended, blue; F folded, green; C another low energy conformation, red) and symbol shape to denote the hydrogen bonding graph set, some of which are defined in Fig. 4. Open symbols denote the corresponding lattice energy minima for the experimental structures (labelled on Fig. 4) which are red for Z′ = 1 structures included in the search and orange for Z′ = 2 structures which are beyond the scope of the search.

