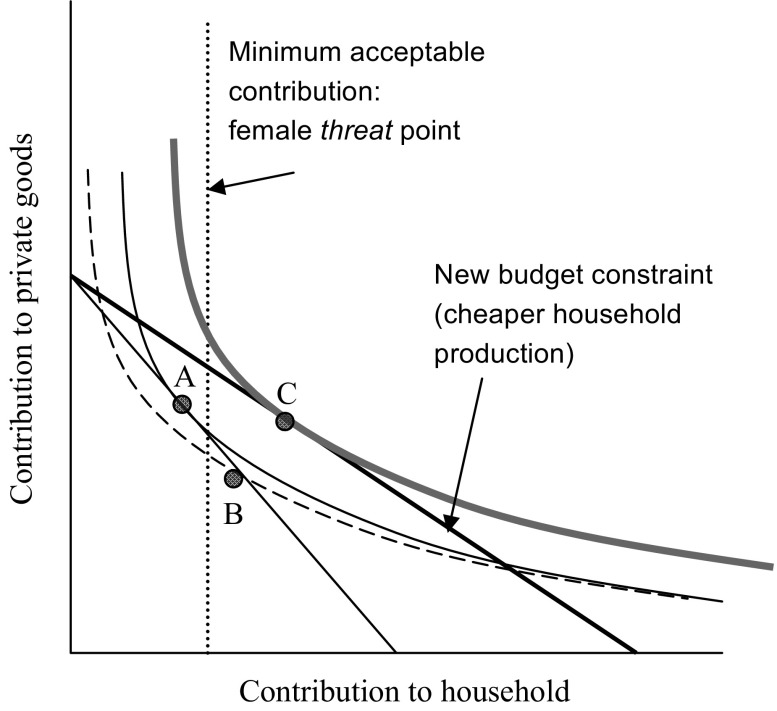
Fig. 1.
Isofitness framework underlying a man’s optimal mix of contributions to household and private goods. Straight diagonal lines represent budget constraints underlying a man’s use of time. Point A is the optimal allocation of a man’s time to household and private goods, but this point lies below the woman’s minimum acceptable level of household contribution, or “threat point.” Threat points are based on a spouse’s opportunity costs to household contributions, where greater potential fitness gain outside the union raises one’s threat point. A man will choose the suboptimal allocation at point B to avoid desertion by his wife. The thick black budget line illustrates the case where household goods are more cheaply acquired than with the thin black budget line. Under this scenario, the optimal mix is illustrated by point C. As noted in the text, the shape of indifference curves depends on several key functional relationships

