
Fig. 1.
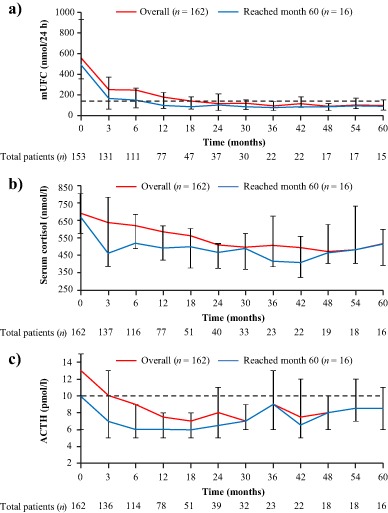
Median a mUFC, b serum cortisol and c ACTH levels from baseline up to month 60. Error bars show 95% distribution-free confidence limits for median values. Numbers of patients with evaluable measurements are shown beneath each time point for the overall population. Dashed lines represent ULN for UFC (145 nmol/24 h) and ACTH (10 pmol/l). Data for the overall population (n = 162) have previously been reported up to month 12 [7] and month 24 [8]