
Figure 7.
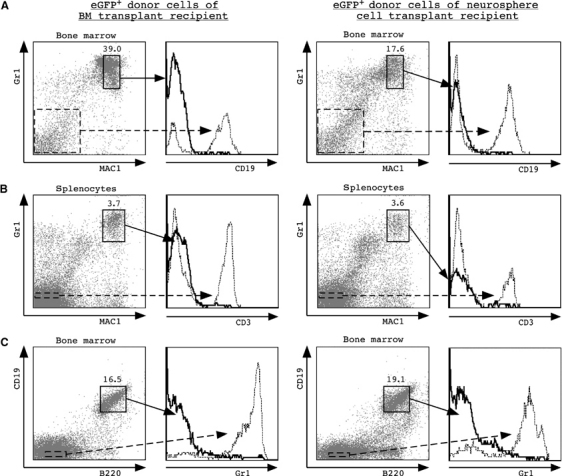
Myeloid/lymphoid-specific marker expression of neurosphere-derived bone marrow cells and splenocytes. Analyses of representative animals 3 months post-transplant are shown (bone marrow transplant recipient (left); TSA/AzaC clone 1 recipient (right); two transplanted animals were analysed with similar results). Percentages of gated eGFP+ donor cells are plotted against lineage-specific staining. (A) eGFP+ donor cells in bone marrow were gated and plotted versus MAC1 and Gr1 staining; eGFP+ MAC1+ Gr1+ cells were gated and plotted versus CD19 staining. As a control, eGFP+ MAC1− Gr1− non-myeloid cells were plotted versus CD19 immunoreactivity (hatched line). (B) eGFP+ splenocytes were stained with anti-MAC1 and anti-Gr1 antibodies and counterstained with anti-CD3 antibodies. Gated eGFP+ MAC1− Gr1− cells were plotted versus CD3 staining (hatched line). (D) eGFP+ bone marrow cells were gated and plotted versus B220 and CD19 immunoreactivity; eGFP+ B220+ CD19+ cells were counterstained with anti-Gr1 antibodies. Gated eGFP+ B220− CD19− cells were plotted versus Gr1 staining (hatched line). Analyses of a representative animal 3 months post-transplant are shown.