
Figure 8.
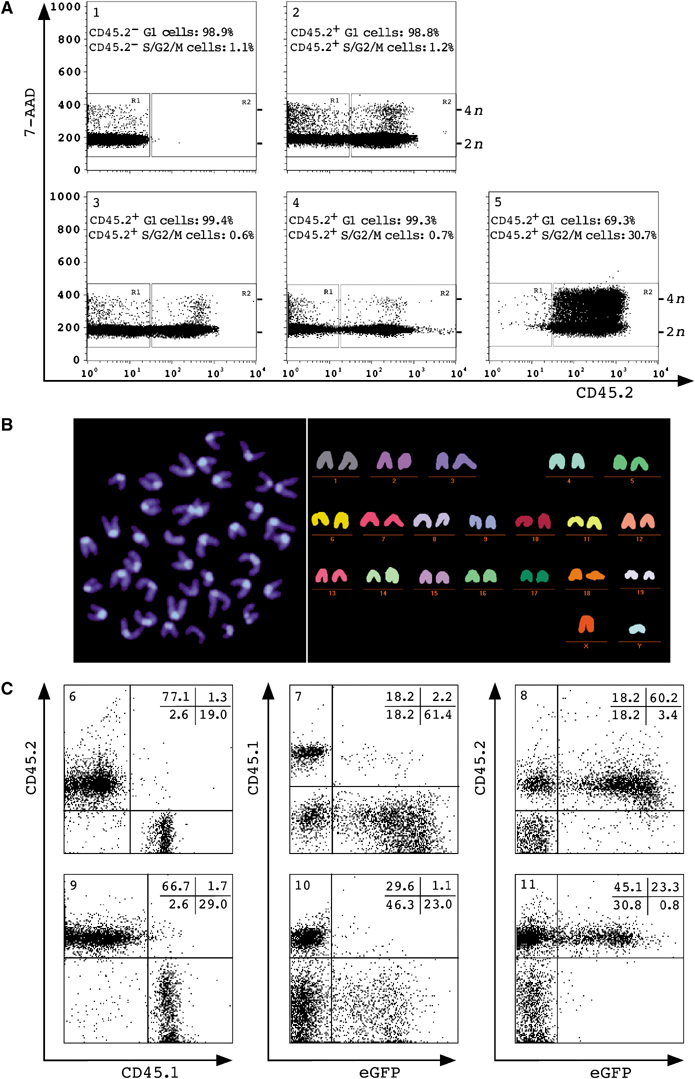
DNA content and M-FISH analysis of TSA/AzaC eGFP/bcl2 neurosphere-derived haematopoietic cells. (A) Splenocytes of a nontransplanted CD45.1 animal (panel 1), of CD45.1 recipients of CD45.2 bone marrow cells (panel 2), of treated bulk (panel 3) or clone 1 CD45.2 neurosphere cells (panel 4) and splenocytes of a nontransplanted CD45.2 control animal grown in vitro (panel 5) were stained with anti-CD45.2 antibody and 7-AAD. Panels 1–4 show the analysis of freshly isolated splenocytes; cells in panel 5 were ConA-stimulated. Position of recipient (R1), donor cells (R2), 2n, 4n cells and % of cells with 2n (G1) or >2n (S/G2/M) are shown. (B) DAPI image (left) and multicolour karyogram of a representative donor splenocyte (right) (n=20). Sorted CD45.2+ splenocytes of a clone 2 recipient (6 months post-transplant) were grown in vitro and analysed. (C) Allele-specific FACS analysis of peripheral blood cells of a transplant recipient of bulk TSA/AzaC neurosphere cells (panels 6–8) or splenocytes of a TSA/AzaC clone 1 recipient (panels 9–11). Shown are cells stained with anti-CD45.1 and anti-CD45.2 antibody (panels 6 and 9) and with either anti-CD45.1 (panels 7 and 10) or anti-CD45.2 (panels 8 and 11) antibody and plotted against eGFP. Animals shown were analysed 3–5 months after transplantation.