
Figure 1.
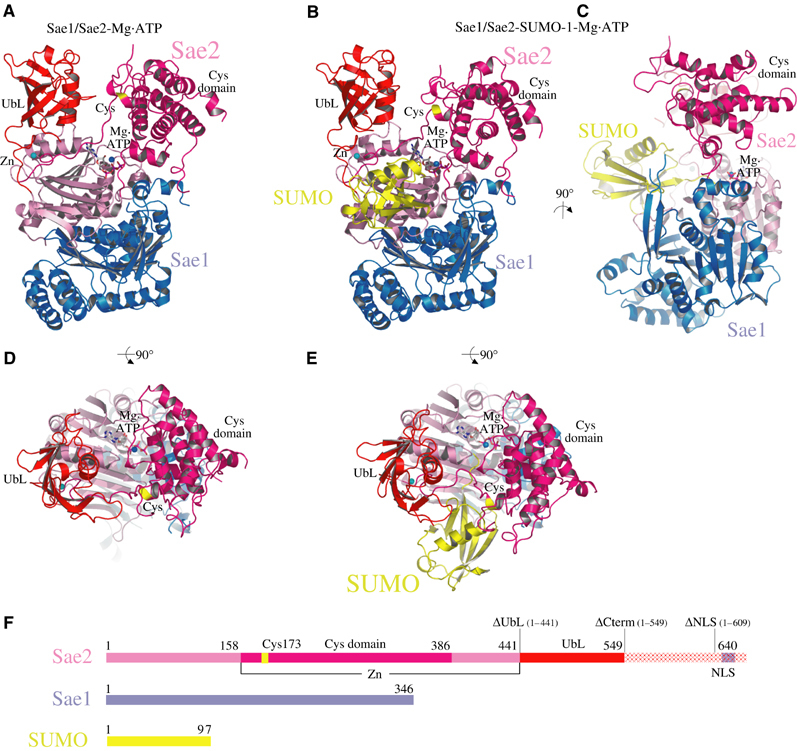
Structure of the SUMO activating enzyme. (A) Ribbon diagram of the Sae1/Sae2 heterodimer Mg·ATP complex. Sae1 is colored blue and Sae2 is colored shades of pink, magenta, and red. (B) Ribbon diagram of the Sae1/Sae2-SUMO-1-Mg·ATP complex. SUMO is colored yellow. Sae1/Sae2 is colored as in (A). Mg·ATP and zinc are labeled and shown in stick and sphere representation. Catalytic Cys and UbL domains are labeled. The active site cysteine is labeled and colored yellow. (C) Orthogonal view of Sae1/Sae2-SUMO-1-Mg·ATP complex as in (B). (D) Orthogonal view of Sae1/Sae2-Mg·ATP complex as in (A). (E) Orthogonal view of Sae1/Sae2-SUMO-1-Mg·ATP complex as in (B). (F) Schematic representation of Sae1/Sae2 and SUMO-1 colored as in (A–E). C-terminal truncation mutants described in the text are indicated above the Sae2 peptide as ΔUbL, ΔCterm, and ΔNLS. Stereo images of panels A and B are provided in Supplementary Figure 1. Images were generated with SETOR or PYMOL unless noted otherwise (Evans, 1993; Delano, 2002).