
Figure 3.
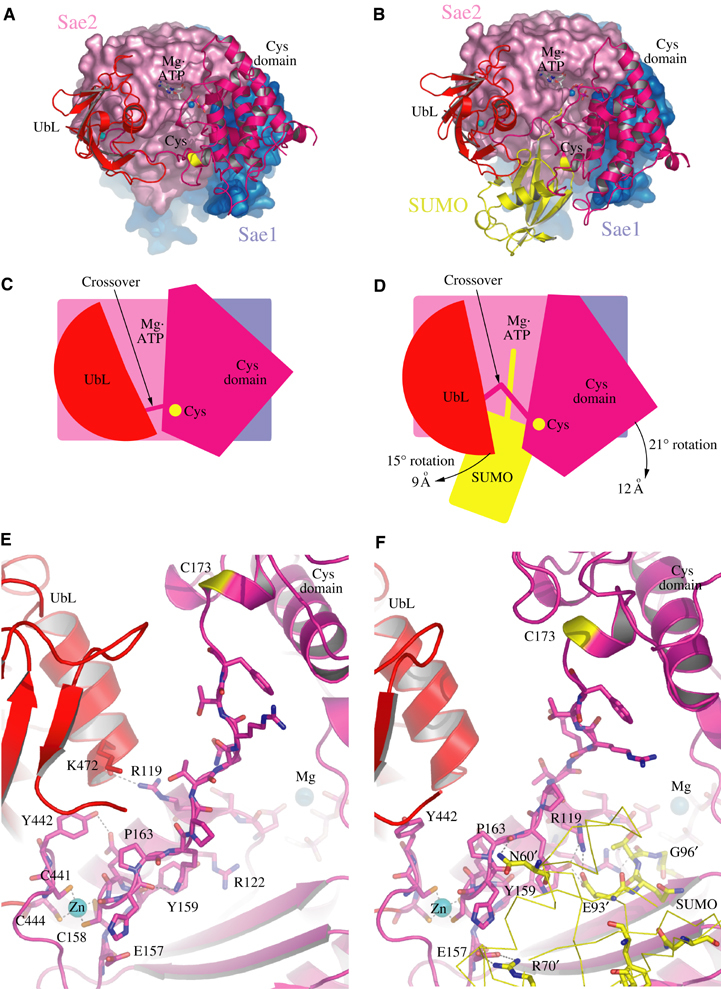
Comparison between Sae1/Sae2-Mg·ATP and Sae1/Sae2-SUMO-1-Mg·ATP complexes. (A) Ribbon and surface representations for Sae1/Sae2-Mg·ATP colored as in Figure 1. (B) Sae1/Sae2-SUMO-1-Mg·ATP complex with SUMO-1 colored yellow. (C) Cartoon representation of (A) with Mg·ATP, catalytic cysteine, crossover loop, with UbL and Cys domains labeled. (D) Cartoon representation of (B) with arrows indicating the direction of observed domain rotations (in degrees) and maximal displacement (in Å). (E) Close-up of the Sae1/Sae2-Mg·ATP complex and crossover loop. Mg·ATP and zinc are labeled with amino acids in stick representation. (F) Close-up of the Sae1/Sae2-SUMO-1-Mg·ATP complex and crossover loop as in (E) but now showing amino-acid residues from SUMO-1 (yellow) interacting with Sae2 residues.