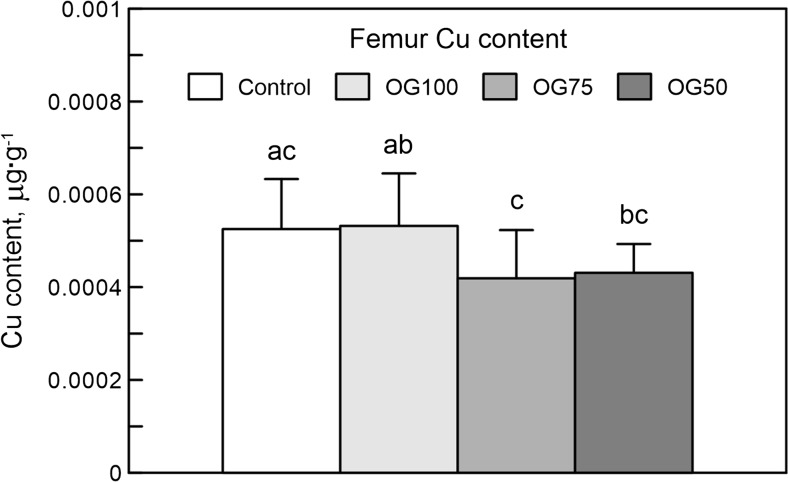
Fig. 2.
The bone content of copper (Cu) in 24-week-old rats treated with Cu in organic (Cu-Gly) and inorganic form (S-Cu) after 12 weeks of the duration of the study. Data given are mean ± SD, *P < 0.05. Differences between letters given above columns (a, b, c) mean significant differences with P < 0.05. The description of the groups as in the Fig. 1

