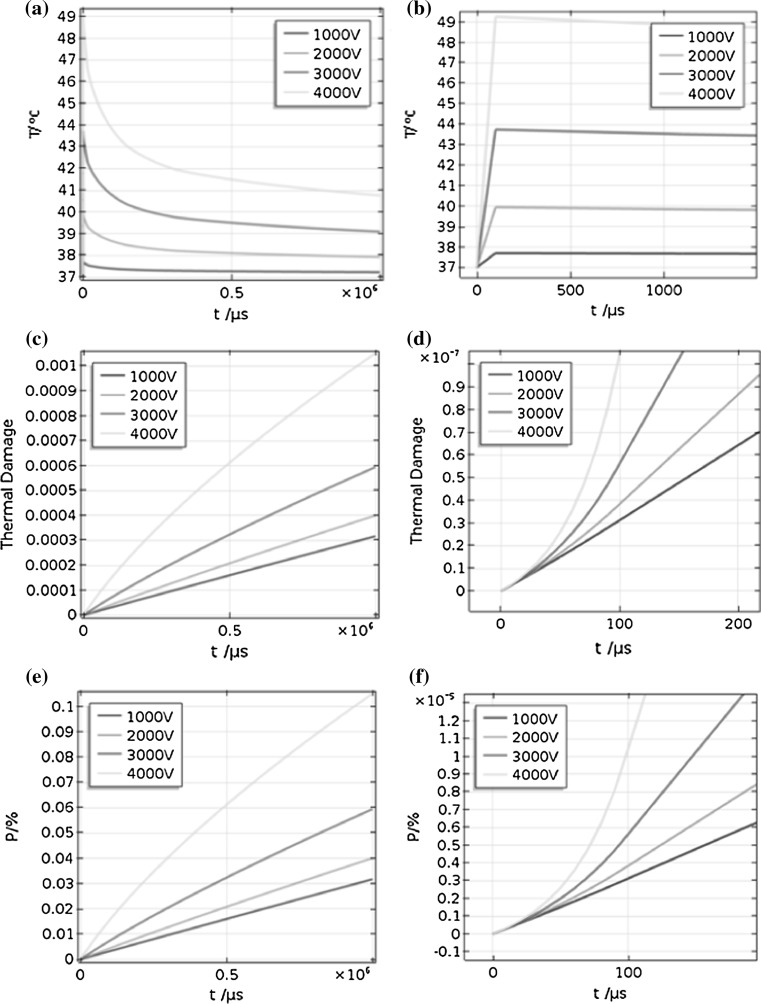
Fig. 4.
Changes in temperature, thermal damage and percentage of cell kill due to thermal damage with time: a, c and e show the temperature, thermal damage and percentage of cell kill due to thermal damage curves, respectively, when the pulse width is 500 ns and the repetition rate is 1 MHz; b, d and f show enlarged versions of (a), (c) and (e), respectively, focusing on the rise time. Different curves are the change under different pulse voltage: 1000, 2000, 3000 and 4000 V

