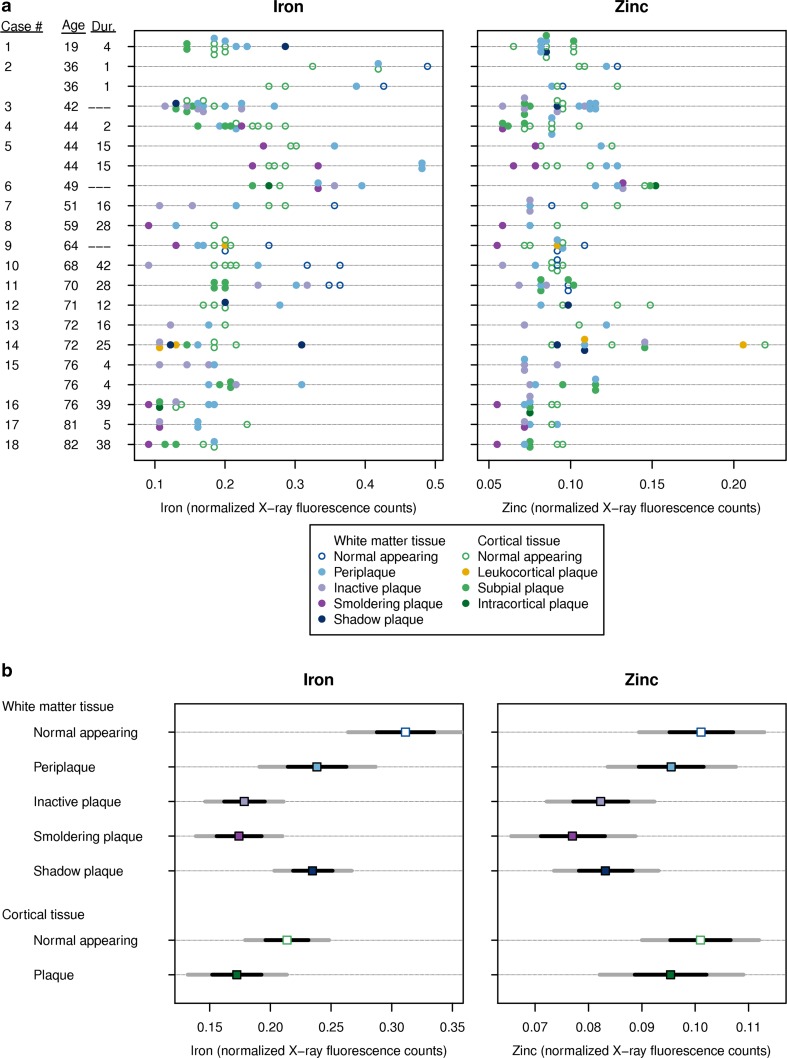
Fig. 1.
Iron and zinc in MS lesions; a Distribution of Fe and Zn normalized X-ray fluorescence values for each of the 21 blocks in the study. Each point represents one region of interest (ROI) on a particular block. The value displayed is the median metal divided by the incident X-ray beam intensity over the entire ROI multiplied by 100. The patient age at death (years) and disease duration (years) are provided on the y-axis, noting that three patients have two blocks; b Estimated metal content with 95% confidence interval (CI) (dark gray lines) and 68% CI (black lines) by plaque type. The two CIs represent ±2 SE and ±1 SE, respectively. Estimates were derived from linear mixed effects models

