Fig. 5.
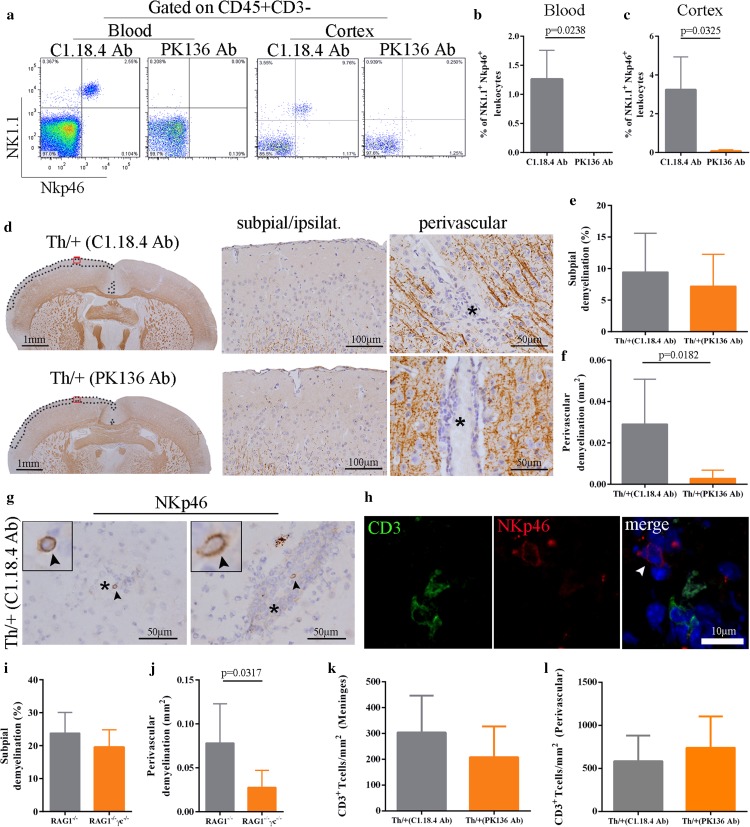
NK cells contribute to perivascular cortical demyelination. a–c Analysis of NK depletion efficiency in the blood (before stereotactic injection) and in the cortex (d5 after stereotactic injection) of Th/+ mice by multicolor flow cytometry. b, c Quantification of NK cells in the blood (b) and the cortex (c) of NK cell depleted (PK136 antibody, n = 4) and control mice (C1.18.4 antibody, n = 3). Data are given as mean ± SD and were analyzed in two independent experiments; Mann–Whitney test. d Subpial and perivascular cortical demyelination as assessed by IHC for MBP (brown color) on day 5 after stereotactic cytokine injection in NK cell depleted Th/+ mice (PK136 antibody, bottom) and controls (C.1.18.4 antibody, top). Red squares in the brain overviews mark the magnified areas in the subpial ipsilateral photographs. Dotted lines define the respective subpial demyelinated areas. Vessel lumina are marked by asterisks. e, f Quantitative analysis of subpial and perivascular cortical demyelination in MBP-immunostained brain sections of 7 animals per group. Data are presented as mean ± SD and were analyzed in two independent experiments; unpaired t test with Welch correction. g Representative IHC of perivascularly located NK cells (NKp46, arrowheads) in the cortex of Th/+ mice. Asterisks mark the vessel lumen. h Immunohistochemical double-labelling of NKp46 (red) and CD3 (green). A perivascular NK cell is marked with a white arrowhead. Nuclei were counterstained with DAPI (blue signal). i, j Quantitative analysis of subpial and perivascular cortical demyelination in 2D2 T cell and anti-MOG antibody (Z2) transferred RAG1−/− (n = 5) and RAG1−/− γc−/− mice (n = 4). k, l Quantitative analysis of meningeal and perivascular CD3+ T cells in NK cell depleted Th/+ mice and controls. Data are presented as mean ± SD analyzed in three independent experiments; Mann–Whitney test

