
Fig. 5.
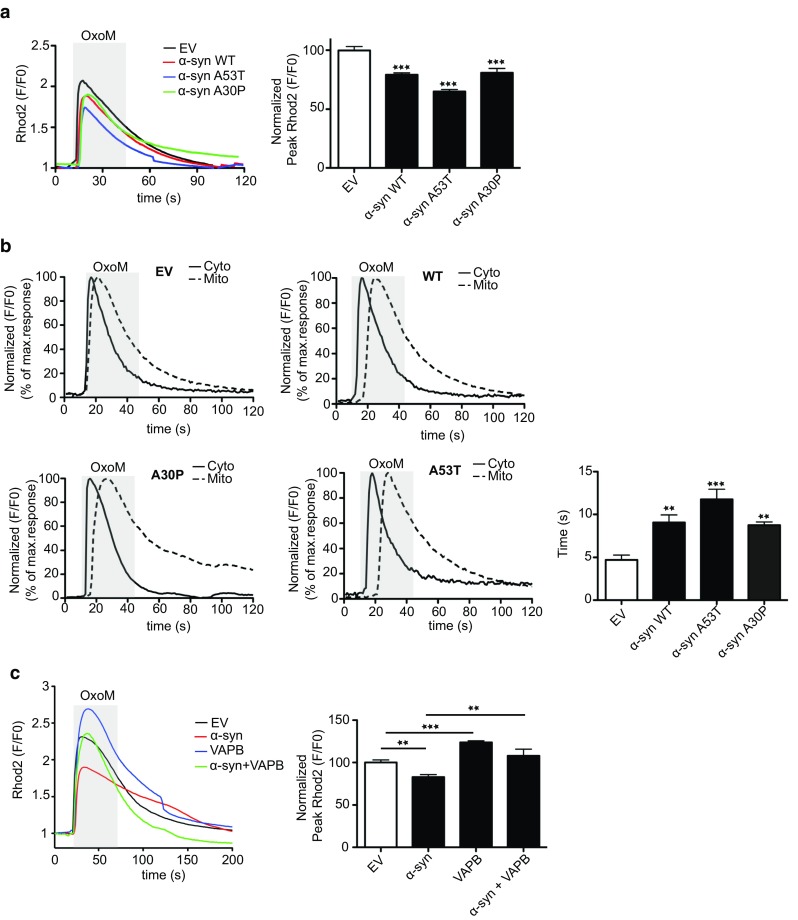
ER–mitochondria Ca2+ exchange is disrupted in SH-SY5Y cells stably expressing α-synuclein and overexpression of VAPB to increase ER–mitochondria contacts rescues disrupted Ca2+ exchange. a, b Reduced mitochondrial Ca2+ uptake and delayed ER–mitochondrial Ca2+ exchange following IP3 receptor-mediated release from ER-stores in α-synuclein, α-synucleinA53T and α-synucleinA30P expressing cells. IP3 receptor-mediated Ca2+ release was triggered with oxotremorine-M (OxoM) and mitochondrial and cytosolic Ca2+ levels detected by Rhod2 and Fluo4 fluorescence, respectively. a Representative Rhod2 fluorescence traces are shown with normalized peak values (F/F 0) in the bar chart. Data were analysed by one-way ANOVA and Tukey’s post hoc test. N = 29–44 cells from 3 different experiments; error bars are SEM, ***p < 0.001. b Delayed mitochondrial Ca2+ uptake following IP3 receptor-mediated release from ER-stores in α-synuclein, α-synucleinA53T and α-synucleinA30P expressing cells. Representative Fluo4 (cytosolic; Cyto) and Rhod2 (mitochondria; mito) fluorescence traces are shown. Bar chart shows the time-lag between peak cytosolic and mitochondrial Ca2+ signals. Data were analysed by one-way ANOVA and Tukey’s post hoc test. N = 85–115 cells from 4 independent experiments; error bars are SEM, **p < 0.01 and ***p < 0.001. c Expression of VAPB to increase ER–mitochondria contacts increases mitochondrial Ca2+ levels following IP3 receptor-mediated release and rescues defective Ca2+ uptake induced by α-synuclein. Representative Rhod2 fluorescence traces are shown with normalized peak values (F/F 0) in the bar chart. Data were analysed by one-way ANOVA and Tukey’s post hoc test. N = 16–72 cells from three different experiments; error bars are SEM, **p < 0.01, ***p < 0.001