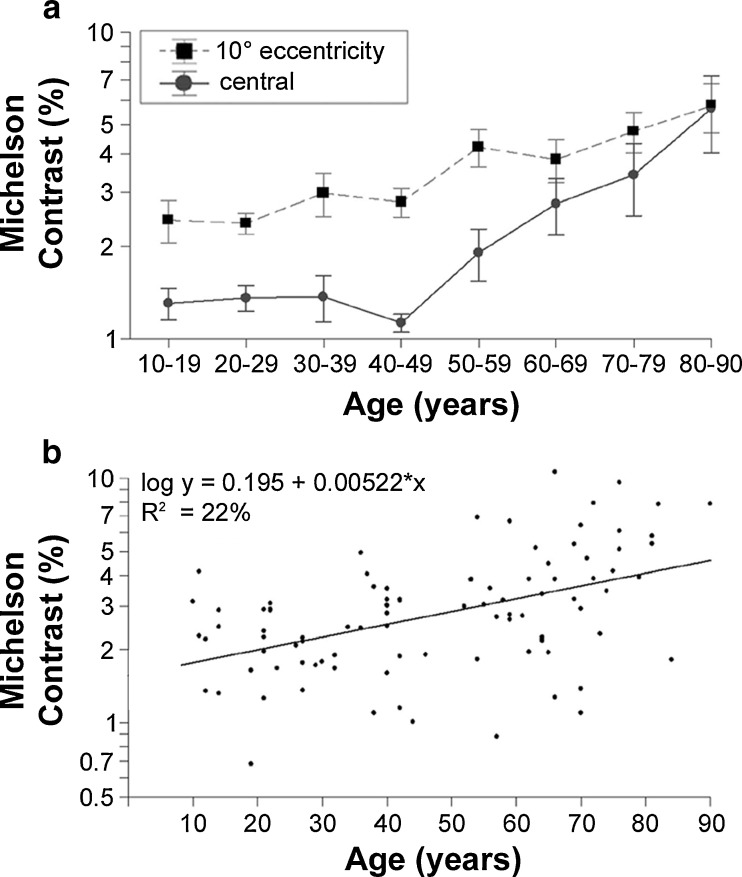
Fig. 13.
Thresholds of recognition contrast over age a Plot of central (solid line) and peripheral (dashed line) log recognition contrast thresholds across age groups. Error bars indicate SEMs of the log. b Scatterplot of individual R_Contrast values over age and log-linear regression, indicating that only 22% of variance in the measurements are explained by observer age

