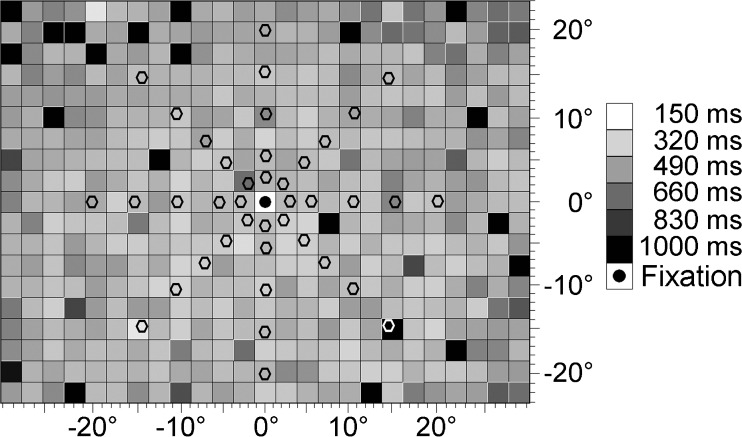
Fig. 2.
Sample reaction time (RT) map measured with high-resolution perimetry. Gray values indicate RTs in a grid of 474 stimulus positions. See text for a description of the method. Hexagonal markers superimposed onto the map indicate visual field locations of double-pulse resolution (DPR) measurement. RTs at these locations were used for data analysis

