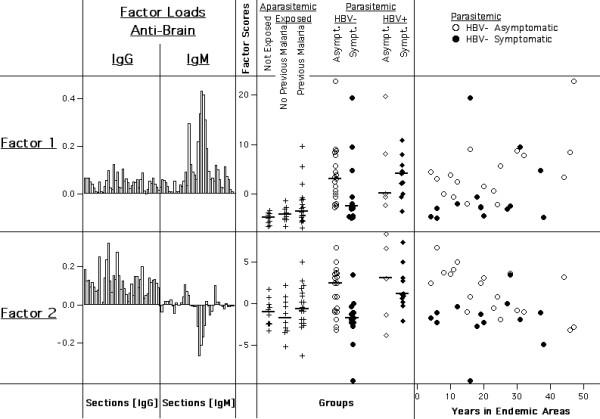
Figure 10.

Principal components derived from IgG and IgM reactivities to human brain taken together. A. Coefficients of factor 1 and 2, representing weight and direction of section reactivities contributing to the respective factor scores. B. Distributions of factor 1 and 2 scores according to subject groups. Vertical bars represent medians within each group. C. Distribution of factor 1 and 2 scores in respect to Malaria exposure (HBV-free parasite carriers only). Different subject groups are represented by the indicated symbols.
