
Figure 6.
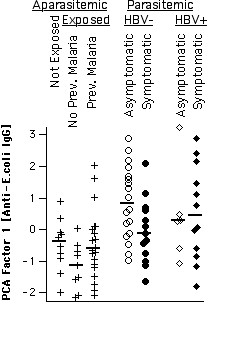
IgG reactivity to E. coli proteins. Distributions of PCA factor-1 scores derived from IgG reactivities to E. coli proteins per group. Group medians are indicated by vertical bars.
Official websites use .gov
A
.gov website belongs to an official
government organization in the United States.
Secure .gov websites use HTTPS
A lock (
) or https:// means you've safely
connected to the .gov website. Share sensitive
information only on official, secure websites.
IgG reactivity to E. coli proteins. Distributions of PCA factor-1 scores derived from IgG reactivities to E. coli proteins per group. Group medians are indicated by vertical bars.