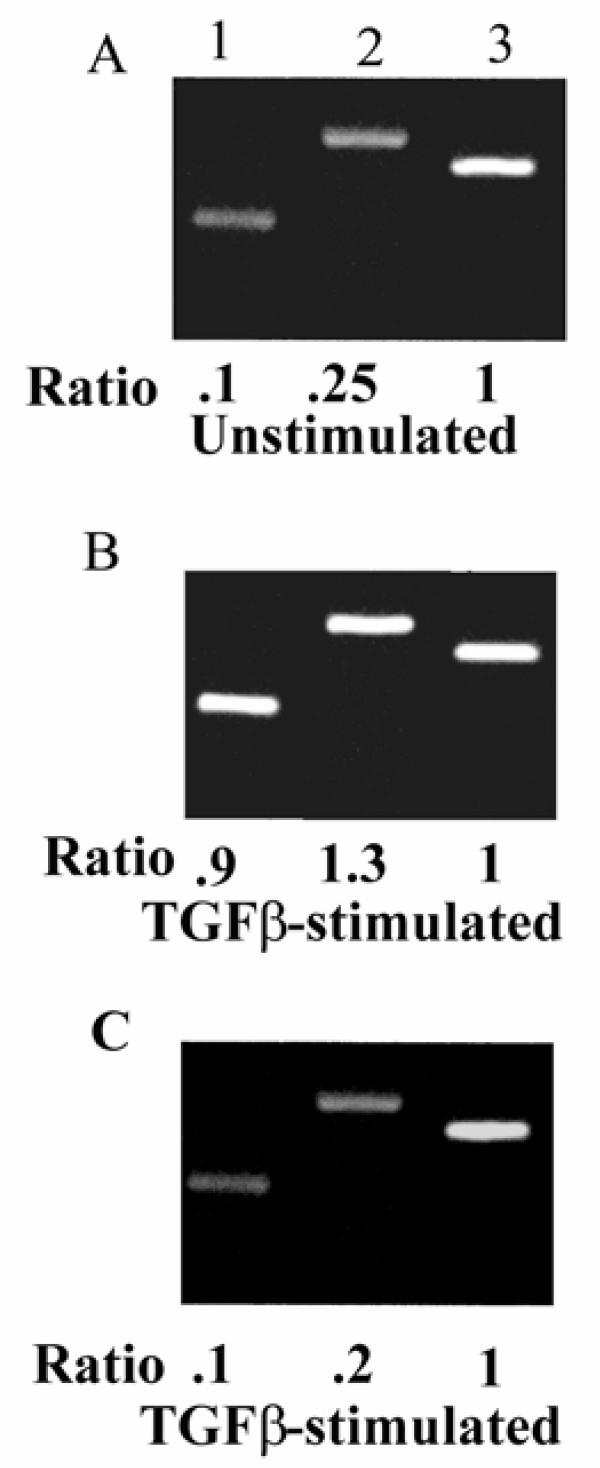
Figure 4.
RT-PCR of uPA and uPAR in breast cancer cells. ZR-75-1 breast cancer cells were cultured as described in the material and methods in the absence (A) and presence (B) of TGFβ (10-10 M). Total RNA was isolated and RT-PCR performed with specific primers for uPA, tPA and uPAR. The housekeeping gene GAPDH was used as a positive control. Lane 1 uPA; lane 2 uPAR; lane 3 GAPDH. The normal breast cell line HME stimulated with TGFβ is shown in (C). Band intensities were quantified by scanning densitometry and data expressed as a ratio (uPA or uPAR/G3PDH) of the average optical density (OD) × area. The ratio of the intensity of the uPA or uPAR mRNA band over the intensity of the G3PDH mRNA was arbitrarily designated as 1.0.

