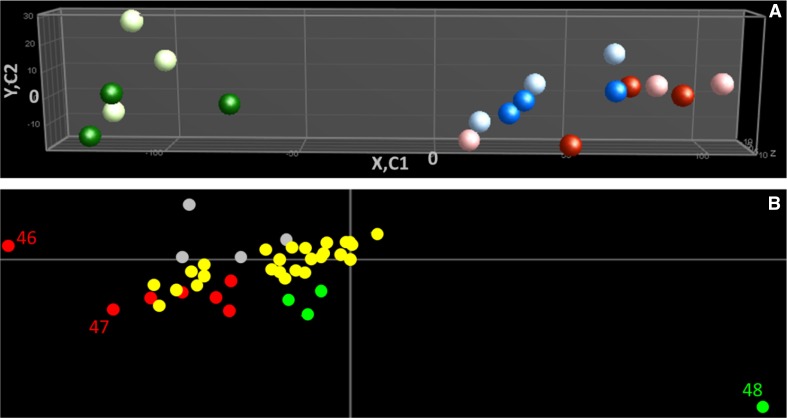
Fig. 3.
Principal component analysis (PCA) of secondary metabolism. The PCA of the samples is represented in (a) with light green dots for 6 mm control (C) sample, dark green dots for 6 mm heat stress (HS) sample, light blue dots for 8 mm-C, dark blue dots for 8 mm-HS, light pink dots for M–C, and red dots for M–HS. Component 1 (C1), component 2 (C2) and component 3 (C3) explain 74.8, 10.3 and 4.3% of the observed variation, respectively. The metabolites responsible for the variation among the samples are represented in (b) with grey dots for unknown compounds, red dots for alkaloids, yellow dots for conjugated polyamines and green dots for flavonoids. 46, beta-tomatine; 47, tomatine and 48 kaempferol dihexoside. The PCA was performed on log2 transformed and mean centred values

