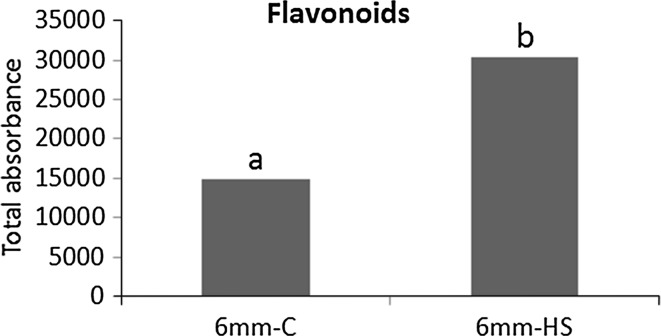
Fig. 6.
Total absorbance of flavonoids under control and heat stress treatments. The total abundance of flavonoids was determined by the sum of the photodiode array absorbance of individual flavonoids at 340 nm ± 15. Stars underline statistically significant differences between 6 mm-C and 6 mm-HS. Letters show statistically significant differences between the developmental stages per metabolite. Similar letters per metabolite indicate that there was no significant difference between the stages. Differences were considered statistically significant when the p value of the ANOVA test was lower than 0.01, and the p value of the Bonferroni post hoc test was lower than 0.05

