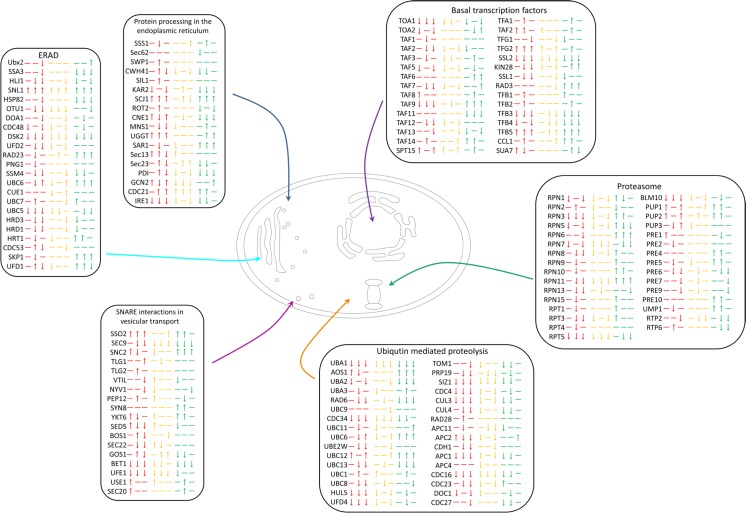
Fig. 5.
Schematic representation of transcriptomic analysis of steps in the pathways involved in protein production and degradation. Significantly upregulated or downregulated genes (compared to wild-type) are depicted with an up or down arrow, respectively. A dash indicates no significant change compared to wild-type. Red indicates low secretors, consistently represented in the order of CV5, CV7 and CV14, yellow indicates mid secretors in the order of CV8, CV15 and CV16 and green indicates high secretors in the order of CV2, CV18 and CV23

