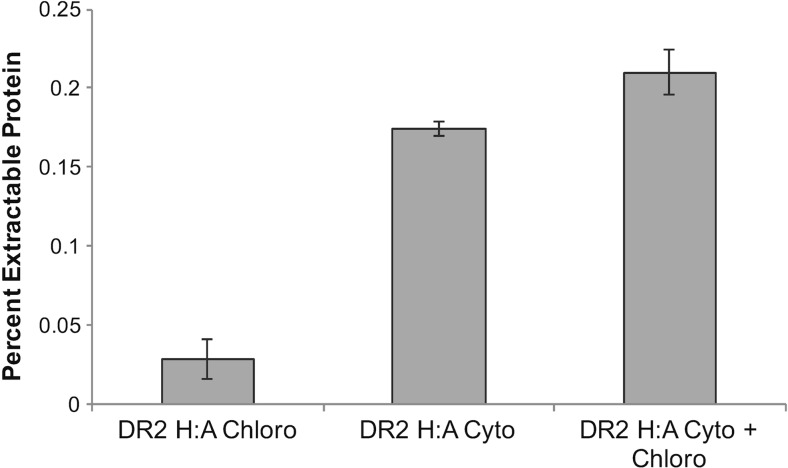
Fig. 5.
Comparison of IbpA DR2 H:A-GFP protein expression levels with chloroplast targeted, cytoplasmic targeted, and combined chloroplast and cytoplasmic targeted transgenic lines. Mean values of Western analysis of IbpA DR2 H:A-GFP expressed as a percent of the total extractable protein. Data are from replicate experiments (n = 2)

