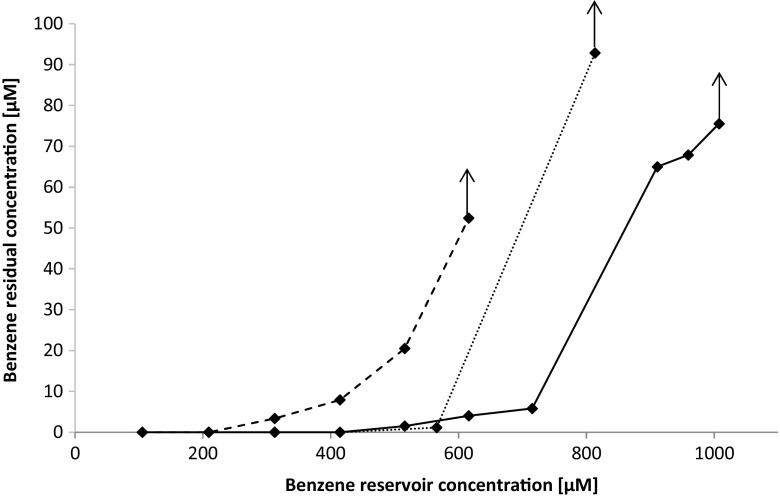
Fig. 5.
Benzene residual concentrations in the continuous culture with retentostat finger. The black line indicates the first (initial) experiment, the dotted line the second experiment at 88 days, and the dashed line the third experiment at 118 days after the initial experiment, respectively. The arrows show reservoir concentrations of 1007, 840, and 616 μM, for the first, second, and third experiments, respectively, where benzene degradation was continuously increased

