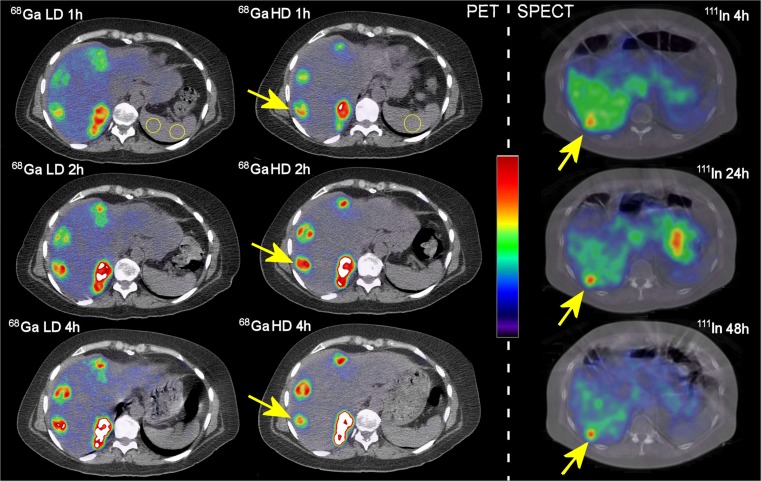
Fig. 1.
Examples of abdominal PET/CT and SPECT/CT images including normal liver, liver metastases and spleen for reference. Left column: low peptide dose [68Ga]-ABY-025-PET/CT at 1, 2, and 4 hours after injection. Middle column: high peptide dose [68Ga]-ABY-025-PET/CT at corresponding time points in the same patient. Right column (other patient): [111In]-ABY-025--SPECT/CT at 4, 24, and 48 hours after injection. The PET colour scale is thresholded at SUV 32. The SPECT images are corrected for the decay of 111In to represent uptake and the colour scale arbitrarily normalised. Arrows indicate a liver metastasis of breast cancer in each of the two patients. Examples of dual spleen VOI:s (spherical) and single slice circular ROI are shown in yellow (first row PET images). 68Ga LD and 68Ga HD stand respectively for low and high peptide content [68Ga]-ABY-025. 111In stands for [111In]-ABY-025

