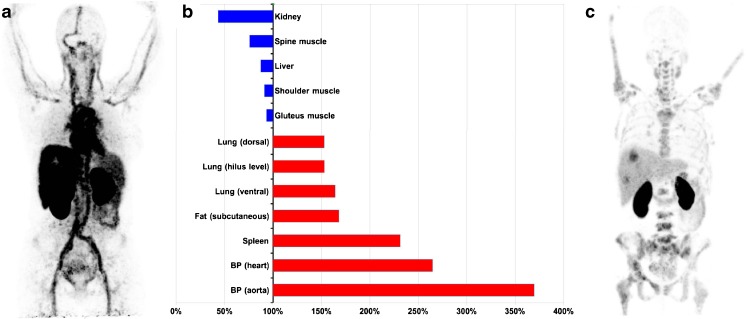
Fig. 2.
(a): Maximum intensity projection (MIP) example of extraordinary shedding after start of HER2-targeted therapy (PET#12) at 2 h after injection (the only available time point in this case). (b): Bar graph of the SUV for this patient’s tissues relative the average of all 16 patients at the corresponding time point. Highest value (370%) was found for the aortic blood pool, with 260% for cardiac blood pool (partly myocardium). Notably, a tilted distribution of activity towards blood and blood rich organs and away from kidney, muscle and liver was seen. (c): For comparison, a MIP of a patient with HER2-positive metastases in liver and bone marrow, but no visible activity in the blood at 2 h. This pattern was seen in 22/23 patients in both ABY-025 studies

