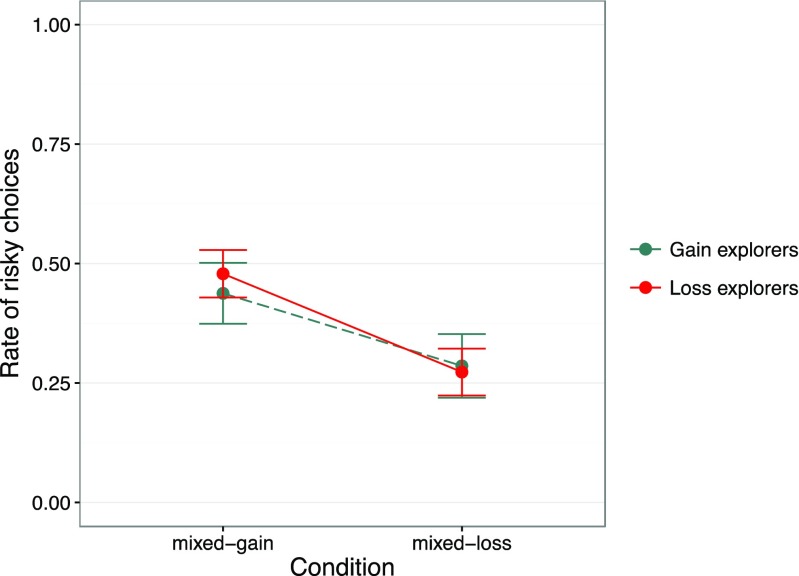
Fig. 5.
Proportion of choices of the risky payoff distribution, separately for gain and loss explorers (see text) and for mixed-gain and mixed-loss problems (see Fig. 4) in the partial-feedback paradigm of the Technion Prediction Tournament data set (Erev et al., 2010). Error bars show 95 % confidence intervals. Gain explorers are shown by a dashed green line and loss explorers by a solid red line. (Color figure online)

