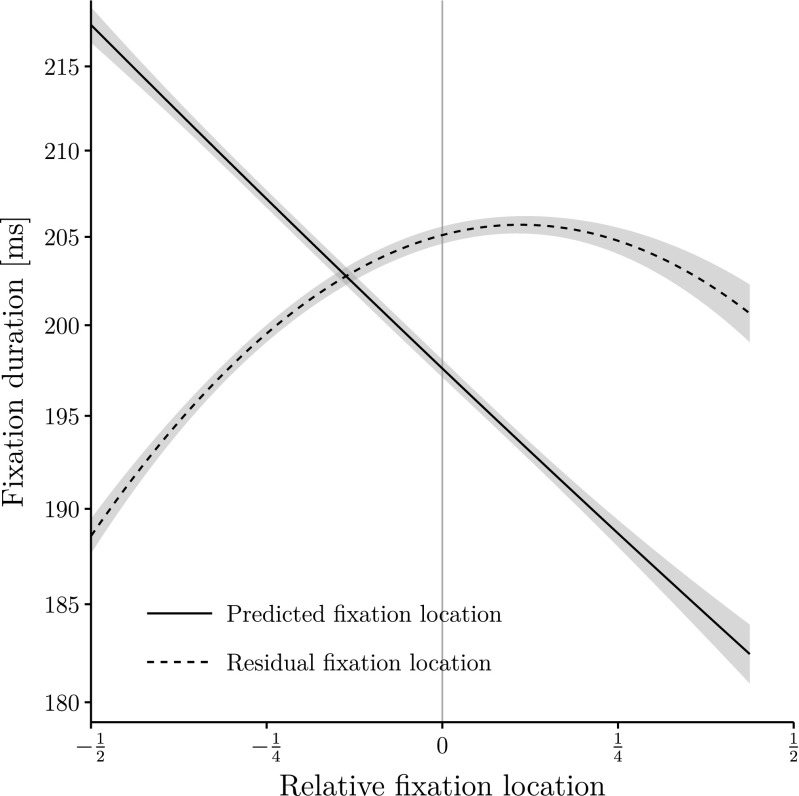
Fig. 4.
Fixation duration on word n (on a log scale) as a function of predicted and residual relative fixation locations together with a second-order polynomial regression curve. The figure displays partial effects created with the remef package (Hohenstein & Kliegl, 2015). Errorbands represent 95 % confidence intervals

