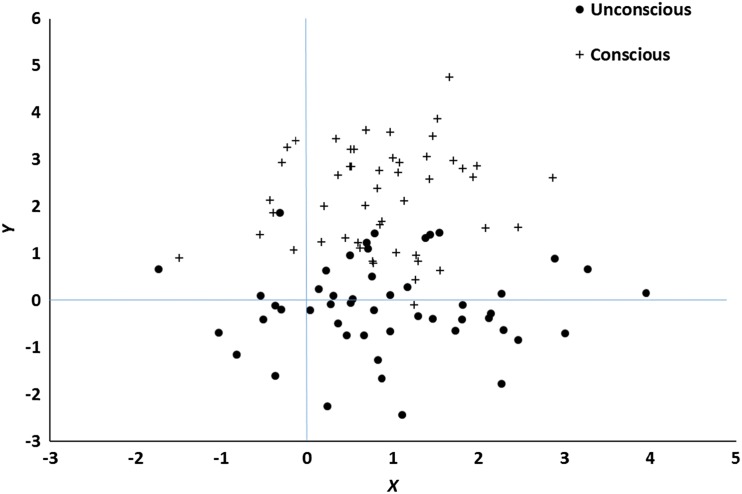
Fig. 4.
Scatterplot of data generated according to the mixture model described in the text. Y is assumed to be a measure of awareness and X a measure of performance. Crosses represent simulated participants whose performance is truly conscious and circles ones whose performance is truly unconscious.

