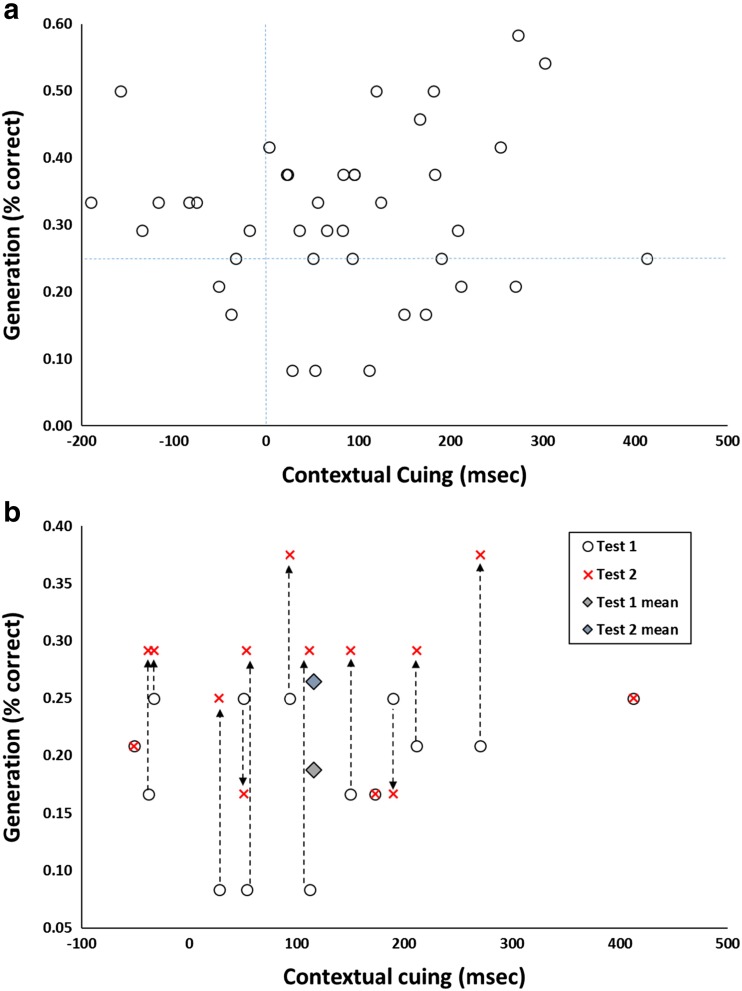
Fig. 6.
a Data from Smyth and Shanks (2008, Experiment 1). Each point represents a participant, plotting the magnitude of contextual cuing (X, the mean priming effect in ms across the final six blocks of the experiment) against awareness (Y, generation score, percentage correct in Test 1). b Data are shown for the 14 participants in Panel A who scored at or below chance (25 %). The open circles reproduce the data from Panel A, and the red crosses show each participant’s score on Test 2. Diamond symbols show the Test 1 and Test 2 means. The majority of generation scores move upwards (become larger) from Test 1 to Test 2, reflecting regression to the mean, and are no longer at or below chance. (Color figure online)

