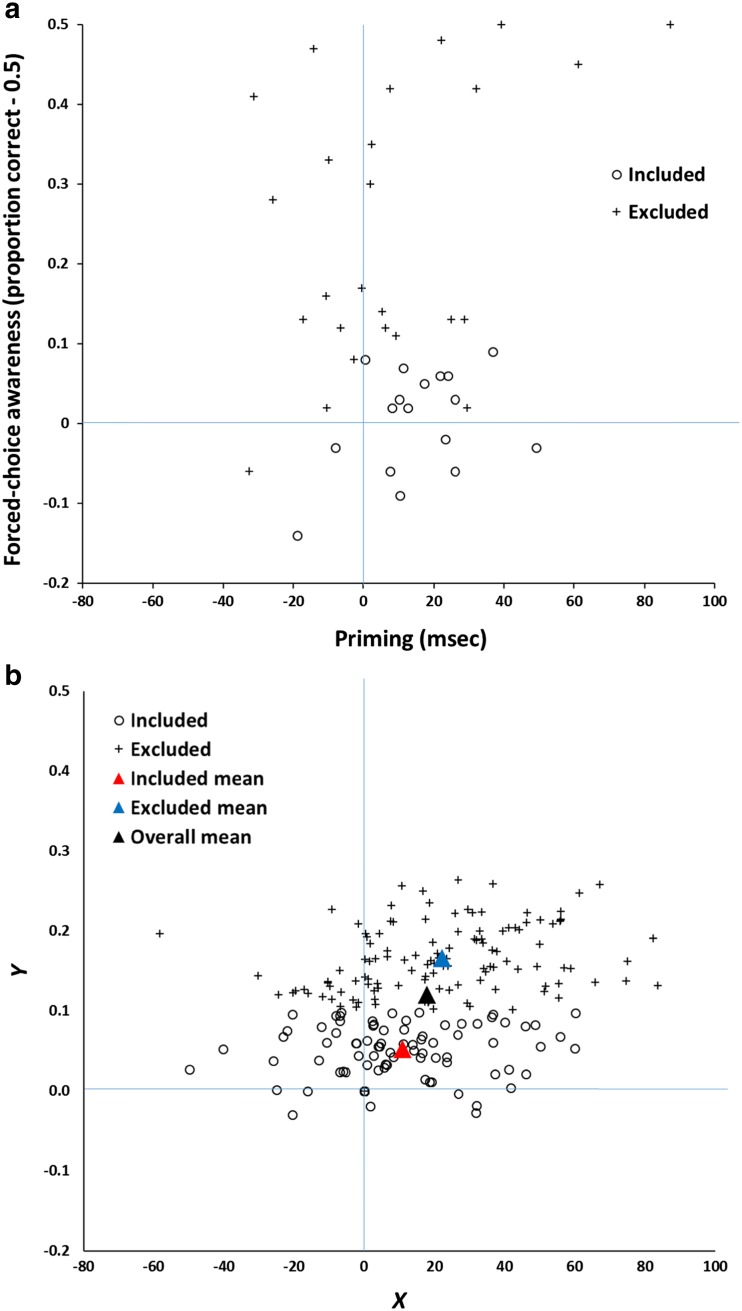
Fig. 7.
a Priming and forced-choice performance in Sklar et al.’s (2012) Experiment 6. Each point represents one participant (n = 42). The x-axis represents the facilitation (ms) for compatible compared to incompatible target stimuli, and the y-axis represents forced-choice accuracy (proportion correct – 0.5). Participants (n = 25) were excluded either if their awareness score was greater than chance by a binomial test (n = 21) or if they explicitly reported awareness of the primes (n = 4). b Simulation of the results shown in Panel A. Data (n = 200) were generated according to Eqs. 8 and 9. Open circles represent simulated participants included by the post hoc method on the basis of Y scores less than or equal to 0.1. Crosses are nonselected participants. Triangle symbols represent the mean scores of the entire sample (black), the included (red) subsample, and the excluded (blue) subsample. The mean X score (priming) is greater than zero in all samples, including those scoring below chance on the awareness measure. (Color figure online)

