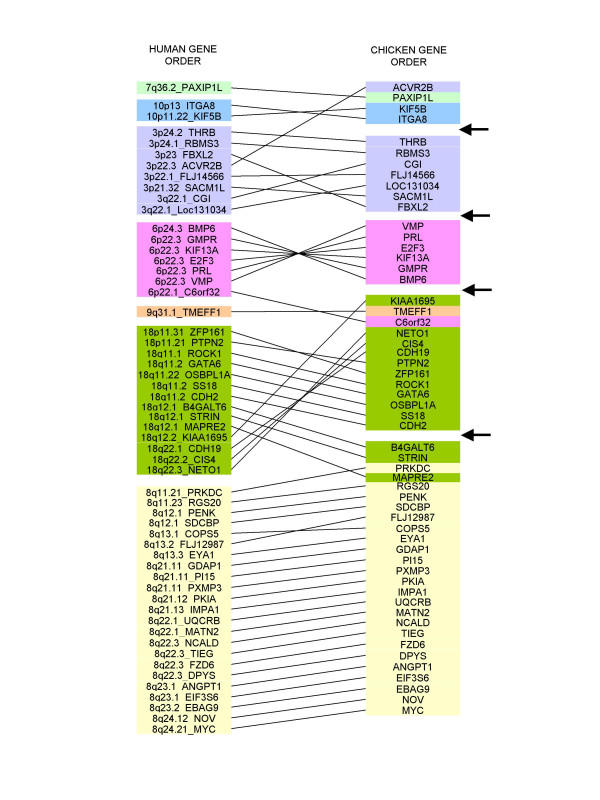
Figure 2.
Comparison of gene orders between the GGA2 RH map and the homologous human regions. The GGA2 RH map (this study) is compared to the order of homologous genes in human (left) Each colour (plain boxes) corresponds to a human chromosome. Arrows on the right indicate the gaps between the 5 framework maps.

