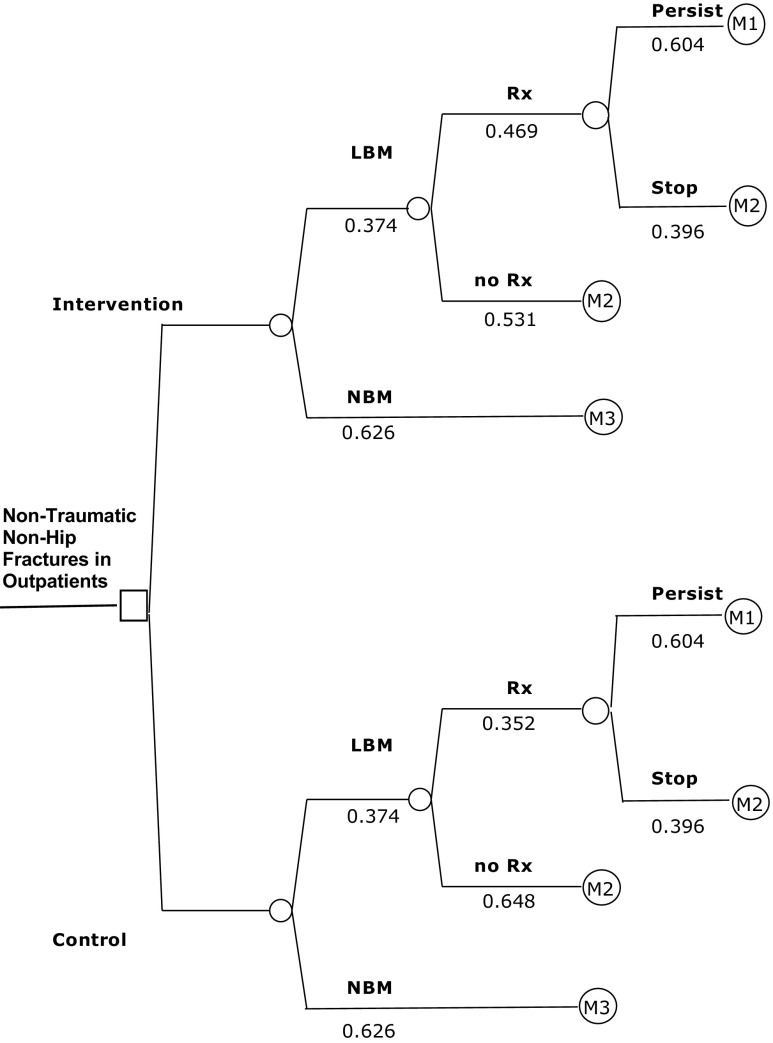
Fig. 3.
Decision tree of the model with Markov processes. Probabilities associated with each chance node are shown under the relevant branch. LBM indicates low bone mass; NBM, normal bone mass; and Rx, treatment with a bisphosphonate. M1, M2, and M3 refer to the individual Markov processes; also, see the “Methods” section and Fig. 2

