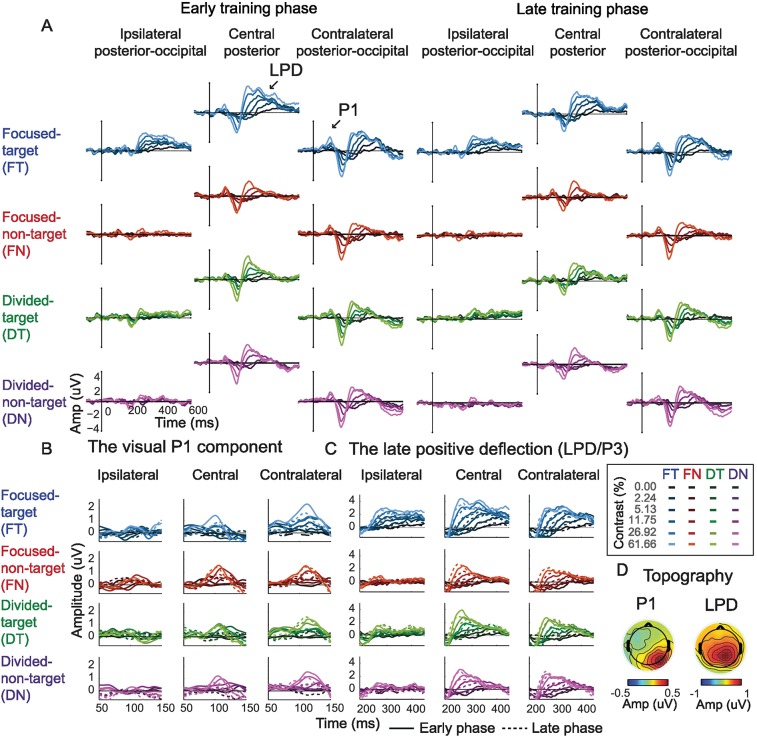
Fig 4. Event-related potential (ERP) results.
(A) ERP traces evoked by the focused target, focused nontarget, divided target, and divided nontarget conditions across early and late training phases. The shading of the colors represents the contrast level of the stimulus (dark to bright colors represent low to high contrast levels). The ERP subtraction method, which helped isolate the ERPs evoked by the stimulus of interest, is illustrated in Fig 3. (B) Zoom-in figure of the visual P1 component. (C) Zoom-in figure of the late positive deflection (LPD or P3). (D) Topographical maps of the P1 and the LPD component collapsed across all experimental conditions. The left and the right sides of the topographical map depict the response in electrodes that are ipsilateral and contralateral to the stimulus of interest, respectively. Data are available from the Open Science Framework (https://osf.io/pc7dr/).

