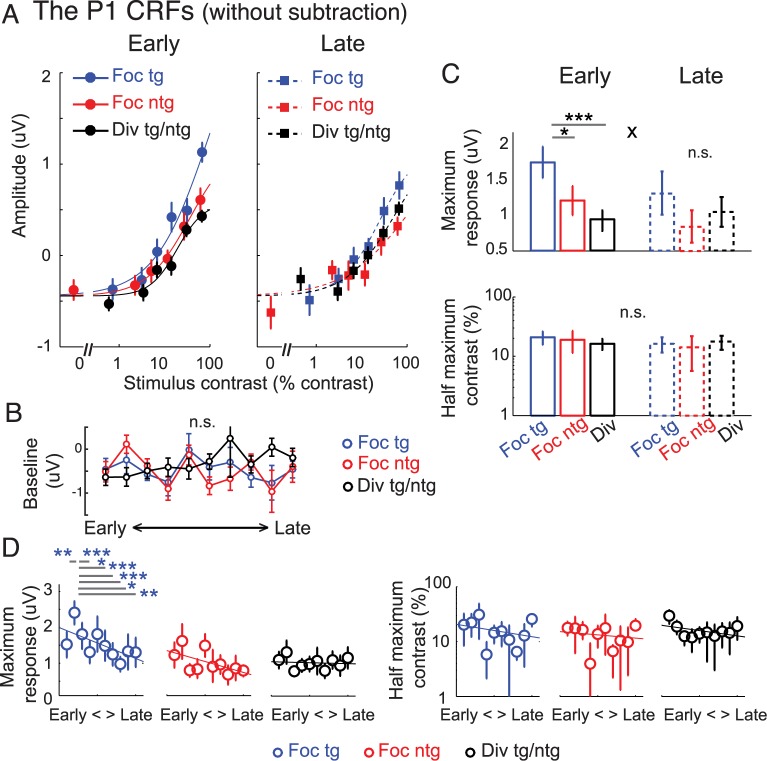
Fig 6. Modulations of the P1 component without baseline subtraction.
(A) The P1 contrast response functions (CRFs) based on event-related potentials (ERPs) without the baseline subtraction. Note that the contrast values on the x-axis are not exactly the same across target and nontarget conditions because in the target conditions we used the averaged contrast values between the pedestal and incremental stimuli. (B) The P1 response amplitude obtained from 0% pedestal contrast stimuli (i.e., baseline activity) across training days (2 electroencephalography [EEG] sessions or ~1 day per time bin). Error bars in (A) and (B) represent within-subject SEM. There was no main effect of attention, no main effect of training, or no interaction between the 2 factors on the P1 baseline activity. (C) Corresponding maximum response (response at 100% contrast minus baseline) and half-maximum contrast for the P1-based CRFs in (A). Overall, the results are consistent with the P1 results with baseline subtraction (Fig 5), in which a gain modulation of the maximum response was observed during the early training phase, but this attentional gain modulation disappeared after training. The main difference between this result and the baseline-subtracted result is that the baselines of the P1 CRFs across all experimental conditions were shifted down and were negative. This was due to an early negative component induced by the stimulus that was ipsilateral to the electrode of interest. Error bars represent the 68% CIs; * and *** represent significant pairwise comparisons between attention conditions in each training phase with p < 0.05 and p < 0.001, respectively. x represents a significant interaction between training (early and late) and attention (focused target and divided attention) with p < 0.05. (D) The day-by-day analysis of the P1 data without baseline subtraction (2 EEG sessions or ~1 day per each time bin). Left and right panels represent the estimated maximum response and half-maximum contrast parameters. Error bars represent the 68% CIs. Blue *, **, and *** in (D) represent significant pairwise comparisons between the maximum response on the second day, on which the behavioral performance started to reach a saturation level (Fig 2C), and the maximum response on other time bins, with p < 0.05, p < 0.01, and p < 0.001 (false discovery rate [FDR]-corrected). Data are available from the Open Science Framework (https://osf.io/pc7dr/). n.s., not significant.

