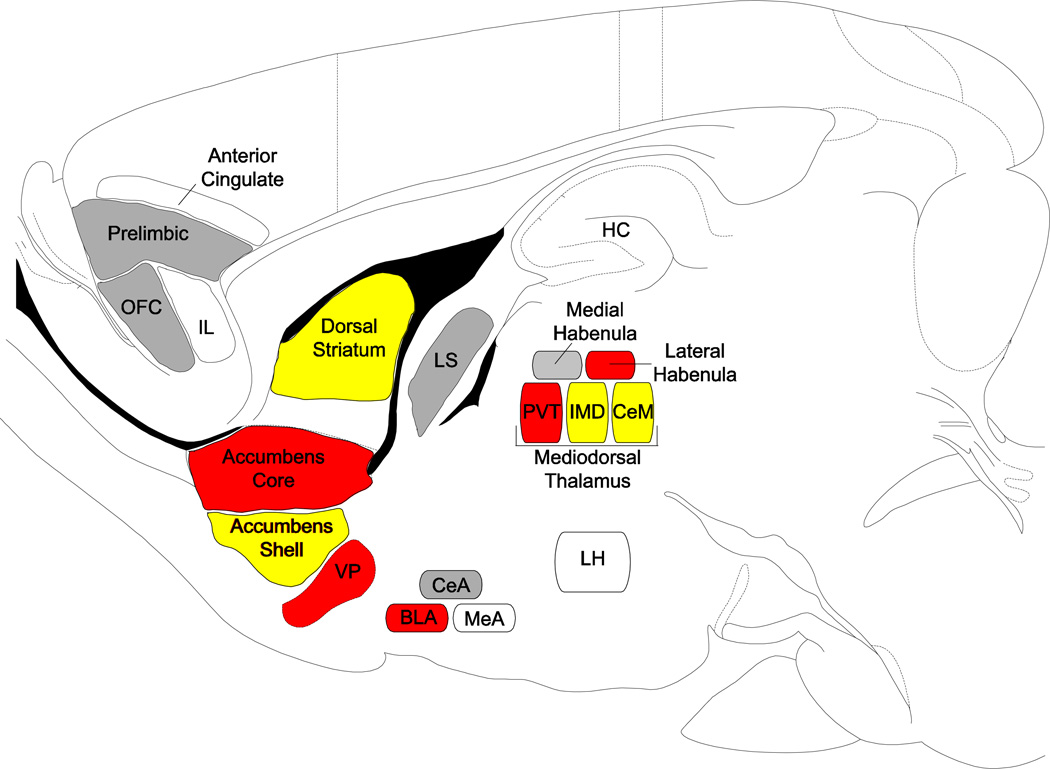
Figure 2. Sagittal schematic of the brain areas that are involved in reward processing for incentive stimuli.
Brain regions highlighted in gray are those that show enhanced cue-induced activation in response to either a food- or drug-cue that has been attributed with incentive salience, but not both; those highlighted in yellow show enhanced activation to both food- and drug-associated cues that have been attributed with incentive salience; and those highlighted in red show enhanced activation in response to a food- or drug-cue, and have also been implicated in incentive salience attribution using other methods (i.e., lesions (PVT, BLA, lateral habenula), chemogenetics (VP), electrophysiology (VP)). Regions that are identified, but not highlighted are those that are believed to be involved in incentive salience attribution, but published data is currently lacking. Abbreviations: BLA, basolateral nucleus of the amygdala; CeA, central nucleus of the amygdala; CeM, central medial nucleus of the thalamus; HC, hippocampus; IMD, intermediodorsal nucleus of the thalamus; LH, lateral hypothalamus; MeA, medial nucleus of the amygdala; PVT, paraventricular nucleus of the thalamus; VP, ventral pallidum Image adapted from [27].

