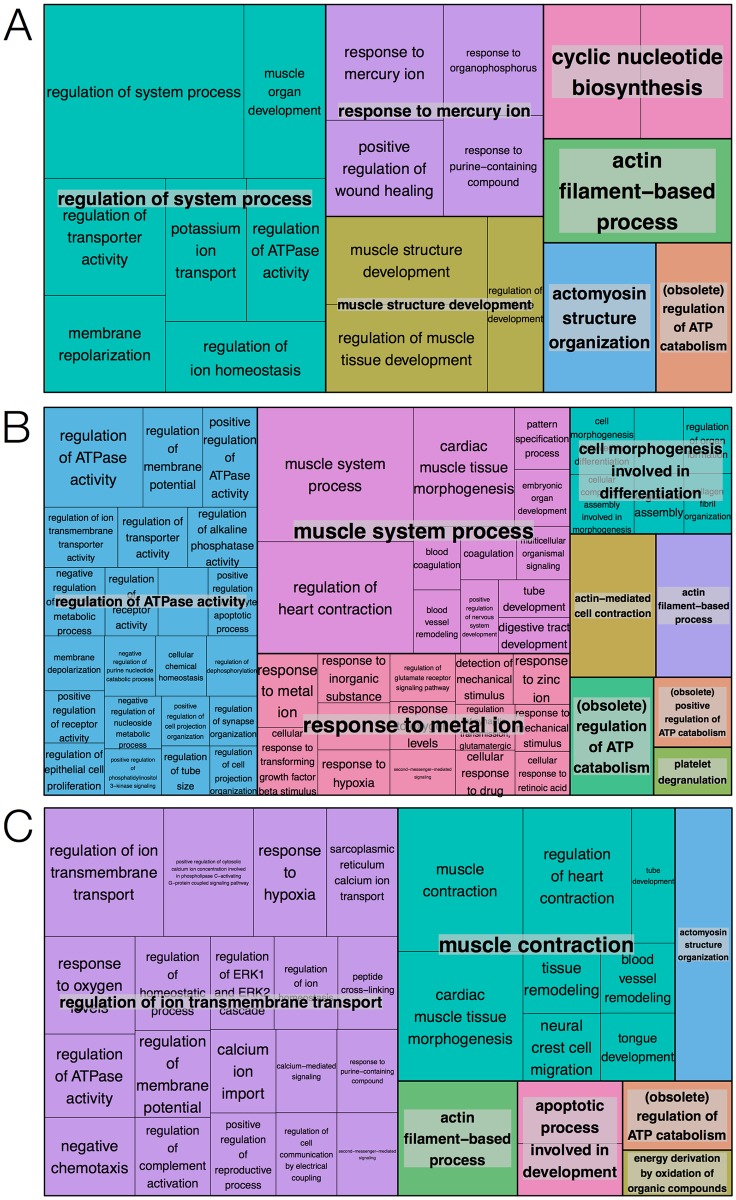
Fig 5. TreeMap visualization of significantly enriched biological processes.
(A) Cluster 7, (B) cluster 9 and (C) cluster 10. Boxes represent terms and the size of boxes reflects the significance of the corresponding p-value. Terms are grouped into overarching terms, which are visualized in different colors. Many terms for clusters 7, 9 and 10 are related to muscle development and ion transport.

