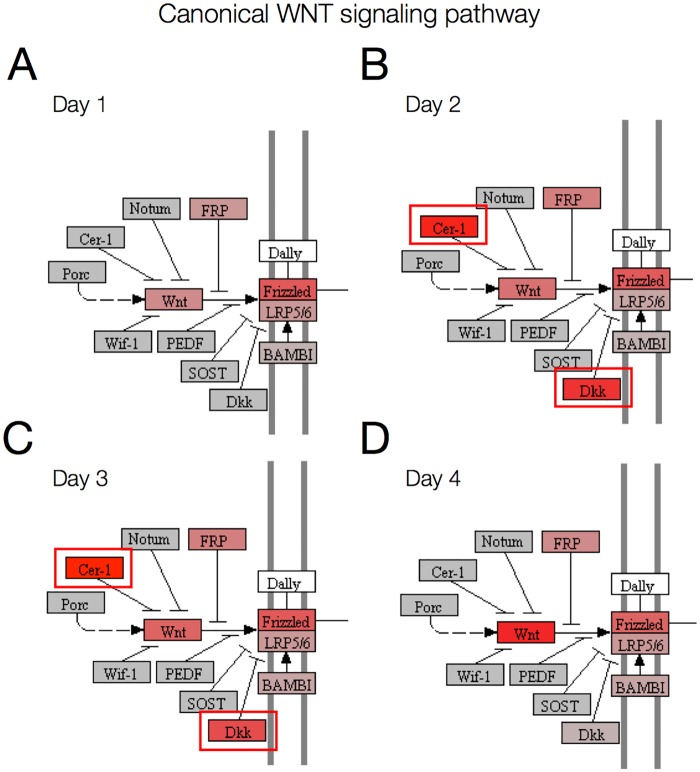
Fig 7. The canonical WNT signaling pathway in KEGG visualized with Pathview.
Genes in the pathway are represented with rectangles. Gene expression is indicated with a color code, where red represents high expression and gray represents expression close to 0. (A) Expression at day 1, (B) expression at day 2, (C) expression at day 3, (D) expression at day 4. This pathway visualization reveals the activation of WNT inhibitors CER1, DKK1 and DKK4 at day 2 and 3 (indicated in red boxes).

