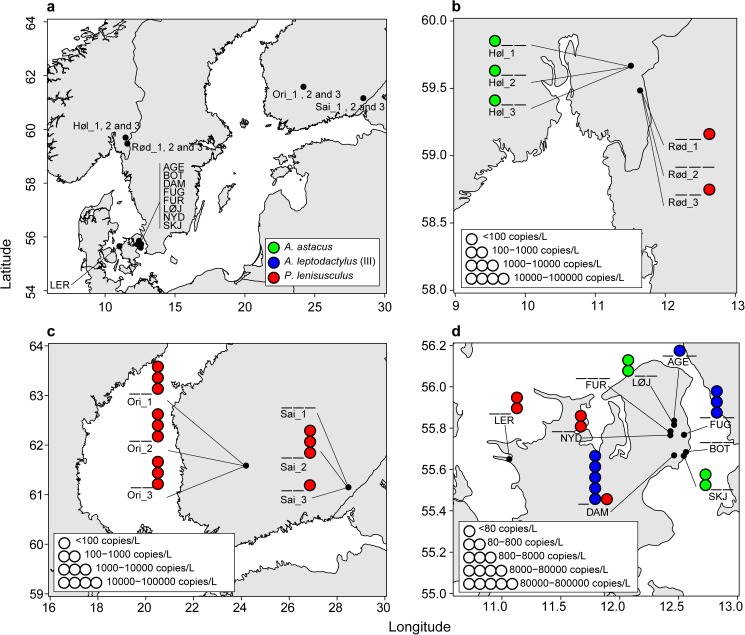
Fig 1. Map of the sampled locations, with detected species and levels of eDNA.
A) Overview of sampling areas in Norway, Finland and Denmark. Abbreviated localities and coordinates are explained and given in Tables 1 and 2. Detection of A. astacus, A. leptodactylus clade III and P. leniusculus are marked with a blue, green and red circle, respectively. Detection of A. leptodactylus clade I have not been included in this figure. None detection of a species is marked with a line. Positive detections with 1 circle is given if the following criteria is fulfilled Ct-value < 41, technical replicate success > 2/4. Detection is quantified if the before mentioned criteria is fulfilled and eDNA concentration is > LOQ. The eDNA concentration levels are grouped into 5 groups with a 10 fold increase, and the LOD and LOQ values found in Figure C and Figure D in S1 File. B) Detection results from Norway. The eDNA concentration levels follows the LOD and LOQ found for the Norwegian and Finnish samples (Figure D in S1 File), with a tenfold increase between levels. C) Detection results from Finland. The eDNA concentration levels follows the LOD and LOQ found for the Finnish and Norwegian samples (Figure D in S1 File), with a tenfold increase between levels. D) Detection results from Denmark. The eDNA concentration levels follows the LOD and LOQ found for the Danish samples (Figure C in S1 File), with a tenfold increase between levels.

