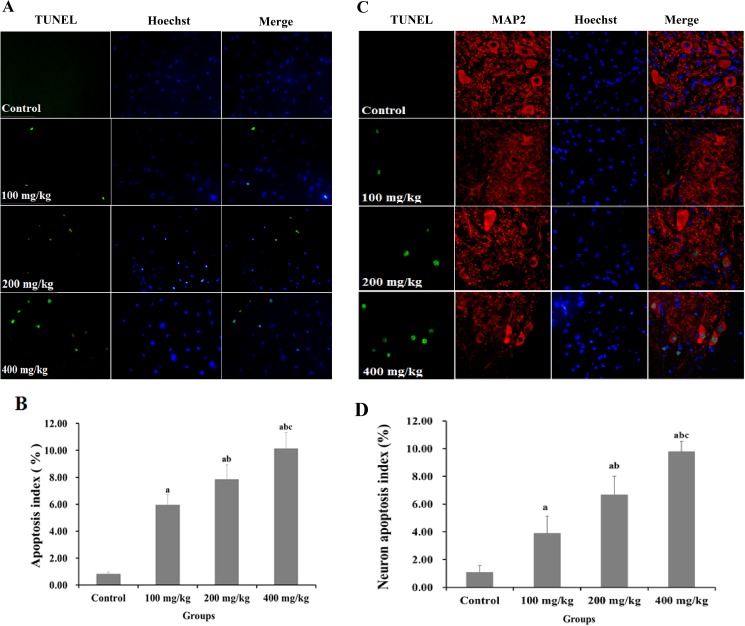
Fig 1. TUNEL analysis of 2,5-HD-induced cell apoptosis in the spinal cord of rats.
Rats were exposed to 0, 100, 200, and 400 mg/kg 2,5-HD for 5 weeks. (A) Representative images of TUNEL stained cells are shown in the control group and the experimental groups. Green fluorescence represents the apoptosis cells, blue fluorescence represents the nuclei of the cells. (B) The apoptosis index of cells in control and the experimental groups. (C) Representative images of TUNEL and MAP2 stained cells are shown in the control group and the experimental groups. Red fluorescence represents the neuron marker MAP2. (D) The apoptosis index of neurons in control and the experimental groups. Data were shown as the mean ± SD, a p < 0.05, compared with control group; b p < 0.05, compared with 100 mg/kg group; c p < 0.05, compared with 200 mg/kg group.

