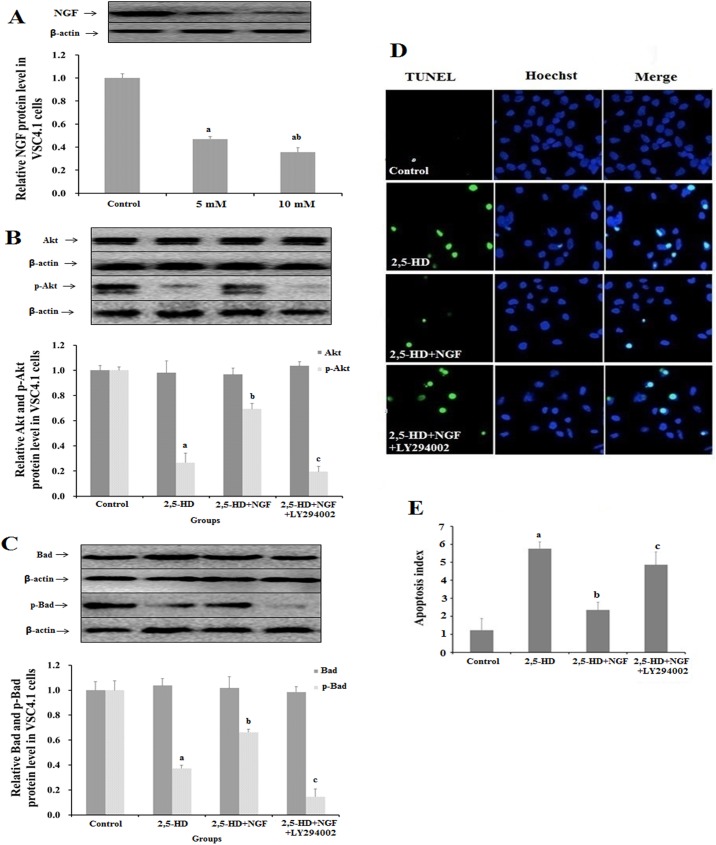
Fig 5. Biochemical analysis of NGF, Bad and Akt expression in VSC4.1 cell line treated with 2,5-HD.
VSC4.1 cells were treated with 0, 5, 10 mM 2,5-HD for 24 h. (A) The expression of NGF protein in VSC4.1 cells was analyzed by Western blot. The cells were treated with 10 mM 2,5-HD, 10 mM 2,5-HD+50 μg/L NGF and 10 mM 2,5-HD+50 μg/L NGF+25 μM LY294002 for 24h. (B) The expression of Akt and p-Akt in VSC4.1. (C) The expression of Bad and p-Bad in VSC4.1. (D) Apoptosis in VSC4.1 cells was observed by TUNEL assay. Green color represents TUNEL-positive cells as apoptosis. Blue color represents cell nuclei counterstained with Hoechst 33342. (E) Bar graph indicating the percentage of apoptotic cells in each group. Data obtained from three separate analyses are expressed as mean ± SD, a p < 0.05, compared with the control group; b p < 0.05, compared with the 100 mg/kg group; c p < 0.05, compared with the 200 mg/kg group.

