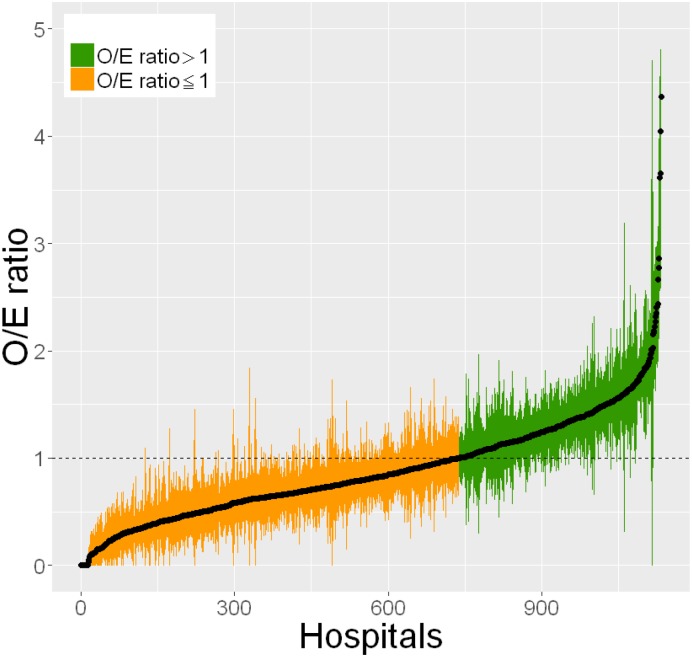
Fig 1. Hospital comparison of observed-to-expected ratios of estimated MRSA incidence.
The horizontal axis represents individual hospitals and the vertical axis represents the observed-to-expected (O/E) ratios. The dots and bars indicate the O/E ratios and the 95% confidence intervals, respectively, of estimated MRSA incidence in each hospital.

