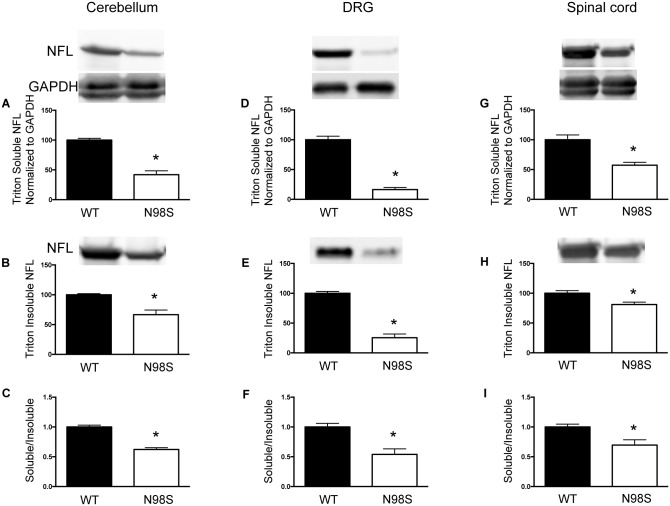
Fig 6. NeflN98S/+ mice showing reduced protein levels of NFL in both triton-X 100 soluble and triton-X 100 insoluble fractions of cerebellum, DRG and spinal cord.
A, D and G) Quantitative data from western blots of triton soluble fraction of cerebellum, DRG and spinal cord, respectively. The intensity of NFL was normalized to that of GAPDH. NFL levels in Nefl+/+ were further normalized to 100. (B, E and H) Quantitative data from western blots of triton insoluble fraction of cerebellum, DRG and spinal cord, respectively. NFL levels in Nefl+/+ were normalized to 100. (C, F and I) The ratio of triton soluble NFL to triton insoluble NFL in cerebellum, DRG and spinal cord, respectively. The ratio of Nefl+/+ was normalized to 100. A litter of 4 Nefl+/+ and 4 NeflN98S/+ mice was used in this study. * p < 0.05.

