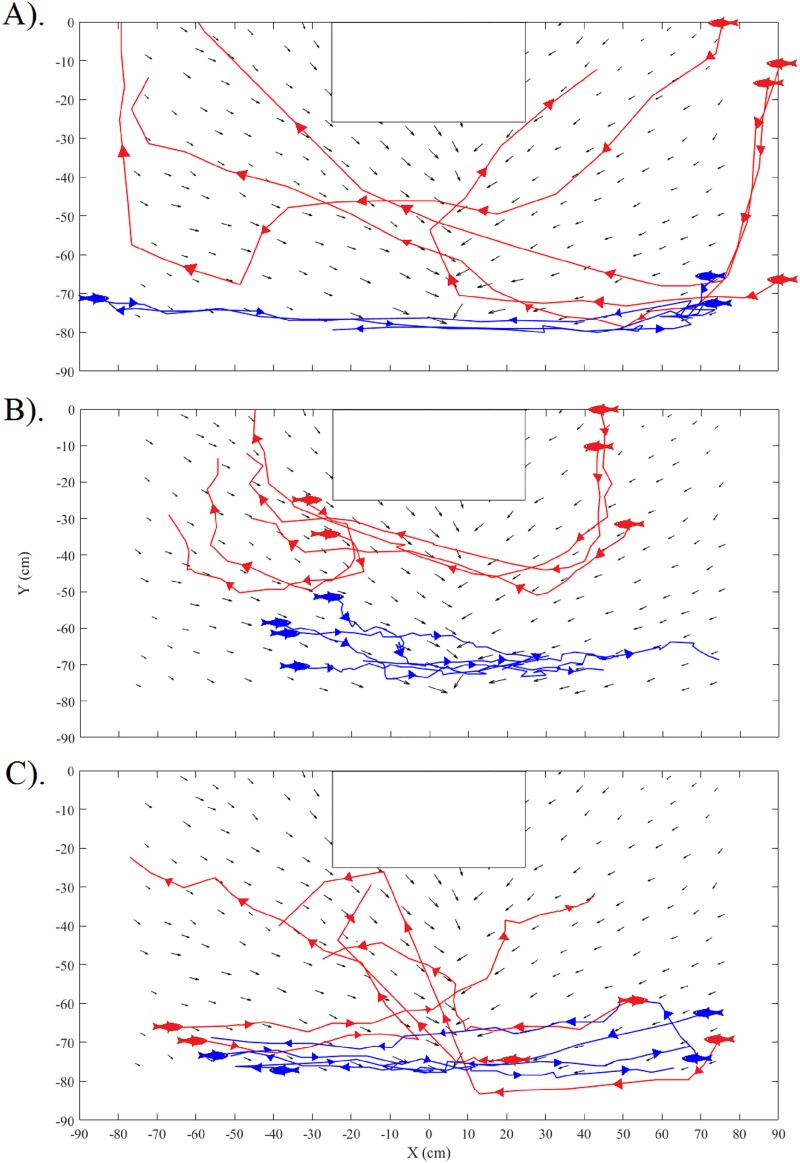
Fig 6. Representative responses of (A) common carp, (B) silver carp, and (C) bighead carp during control (blue lines) and treatment (red lines).
Particle acceleration vectors are shown for reference. A fish symbol denotes the start and arrows indicate direction of movement. Note trajectories follow a curvilinear path parallel to local particle acceleration vectors during treatment periods, while trajectories follow paths parallel to the enclosure wall during control periods.

