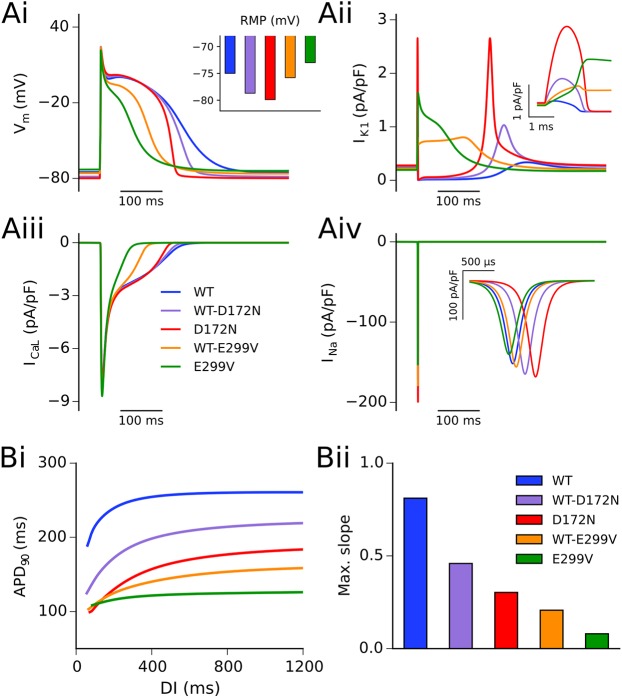
Fig 3. Simulated AP profiles and current traces in WT and mutation conditions.
Action potential profiles in WT (blue), WT-D172N (mauve), D172N (red), WT-E299V (orange), and E299V (green) conditions at a pacing frequency of 1 Hz (Ai), with inset showing RMP. Corresponding current traces are shown for IK1 (Aii), ICaL (Aiii), and INa (Aiv). Insets for panels (Aii) and (Aiv) show current profiles during the AP upstroke for IK1 and INa, respectively. (Bi) Restitution of the APD90 as determined using an S1-S2 protocol, and (Bii) maximal slope of restitution.

