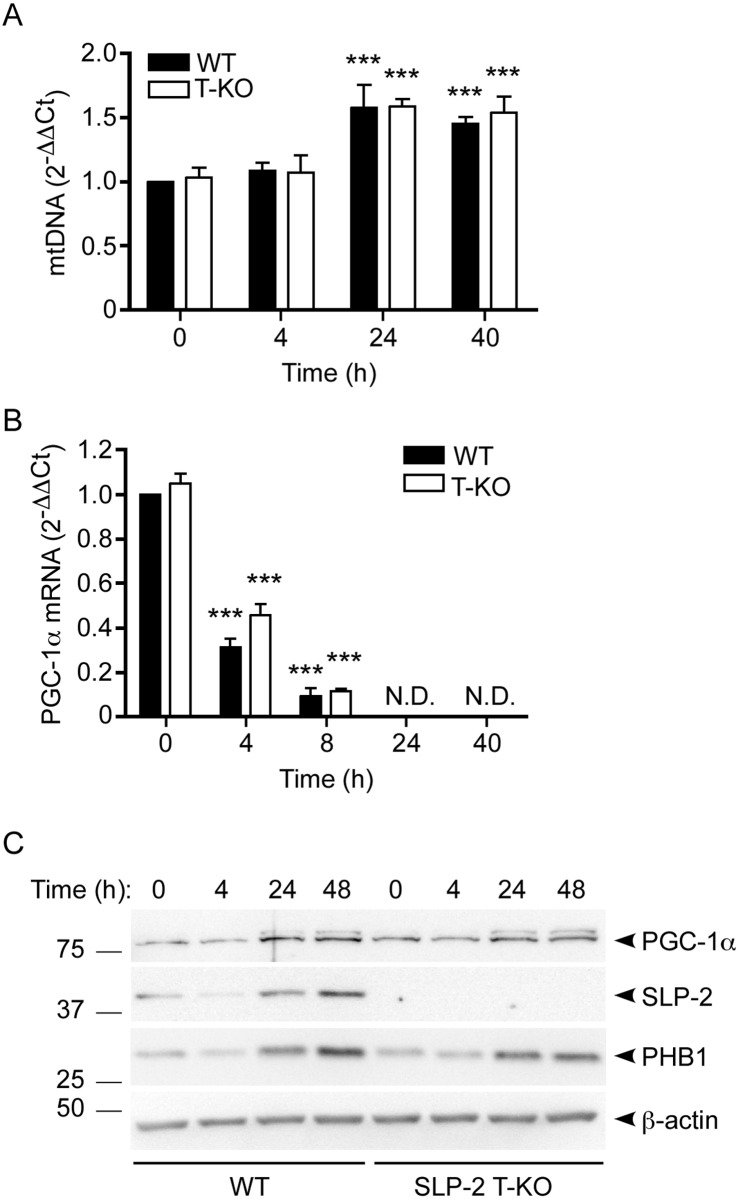
Fig 2. Mitochondrial DNA stability and PGC-1α expression are not affected by deletion of Slp-2 in T cells.
WT and SLP-2 T-KO T cells were resting or stimulated with anti-CD3/CD28 for the indicated times, then total cellular DNA (A), RNA (B) or protein (C) content was isolated. (A) Levels of mtDNA were measured by qPCR and normalized to Rag1 DNA content. Values are relative to the 0 h WT condition. N = 3 mice per group. Statistical significance was calculated using two-way ANOVA. ***: p < 0.001 compared to respective 0 h WT or T-KO control. (B) PGC-1α gene expression was measured by qRT-PCR and normalized to RPL19, B2M, and HPRT gene expression. Values are relative to the 0 h WT condition. N = 4 mice per group. Statistical significance was calculated using two-way ANOVA. ***: p < 0.001 compared to respective 0 h WT or T-KO control. N.D.: Not detected. (C) Cell lysates were resolved by SDS-PAGE, transferred to membranes and immunoblotted with antibodies against PGC-1α, SLP-2, PHB1, and β-actin. Left panel: representative blots are depicted; numbers indicate molecular weight in kDa. The upper band in the anti-PGC-1α blot shows post-translational modification of this protein that may reflect active phosphorylated PGC-1α. Right panel: densitometry was calculated relative to the 0 h WT condition for PGC-1α, SLP-2, and PHB1 (N = 3). Statistical significance was calculated using Student's t test. *: p < 0.05 compared to 0 h WT control. N.D.: Not detected.

