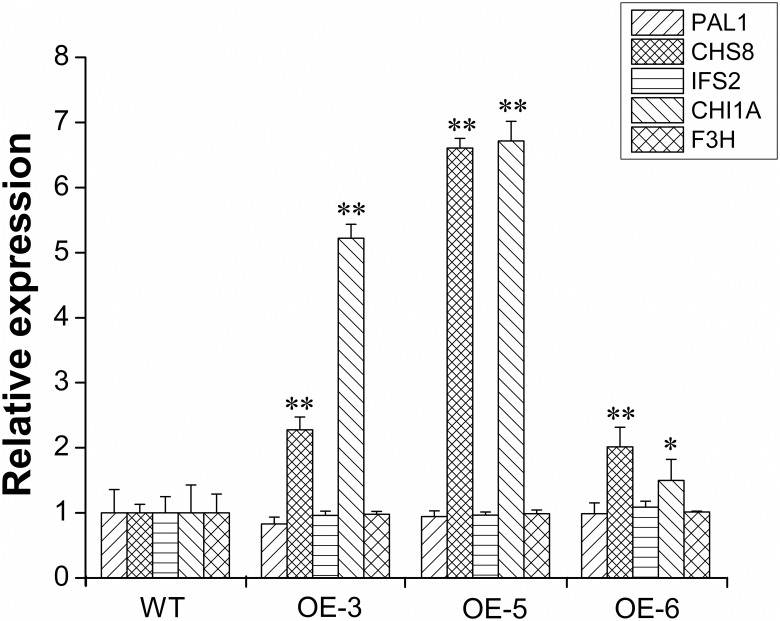
Fig 8. Quantitative RT-PCR analysis of the key genes, PAL1, CHS8, IFS2, CHI1A and F3H, involved in the isoflavonoids synthesis in the seeds of positive T2 transgenic lines.
WT, wild type; OE, independent GmMYBJ3 overexpression lines. The expression data of transgenic and wild-type lines represent the mean ± SD of three independent plants, with each plant having three technical replicates. * and ** represent significant differences at P ≤ 0.05 and 0.01, respectively, between the transgenic lines and WT.

