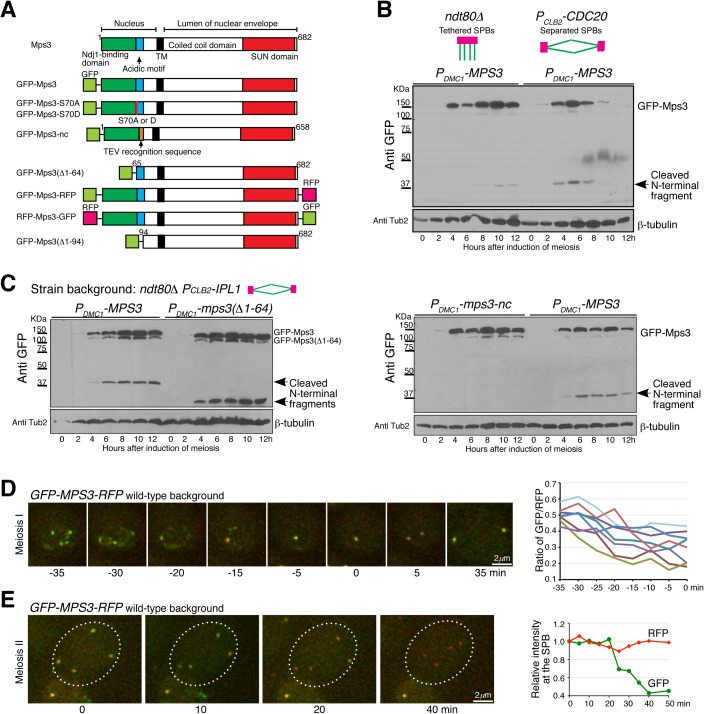
Fig 2. Cleavage of Mps3 during meiosis.
(A) Schematic diagrams showing Mps3 protein structure and MPS3 constructs used in this study. TM, transmembrane domain. (B) Mps3 protein level at prophase I and metaphase I. Yeast cells were induced to undergo synchronous meiosis, and cell aliquots were withdrawn at indicated times for western blot. GFP-Mps3 was detected by an anti-GFP antibody. The arrow points to the cleaved N-terminal fragment from Mps3. Strains HY4430 and HY5268. (C) Western blots probing Mps3 cleavage during meiosis as shown in panel B. Note that removal of the first 64 amino acids from Mps3 reduced the size of GFP-Mps3 and its cleaved product. Strains HY4432 and HY4484. (D) Cytological observation of Mps3 cleavage at the SPB in meiosis I. Yeast cells were induced to undergo synchronous meiosis for about 4 h, and cell aliquots were prepared for time-lapse fluorescence microscopy. The ratio of RFP over GFP at the SPB from 8 cells (n = 26) is shown to the right. Time zero is defined as the point of SPB separation in meiosis I. Projected images from 12 z-stacks were used for display. Strain HY5098. (E) Cytological observation of Mps3 cleavage in meiosis II (n = 50). The averaged fluorescence intensity of RFP and GFP at the SPBs from the cell shown to the left is plotted over time. Time zero is defined as the start point of microscopy. Strain HY5098.

