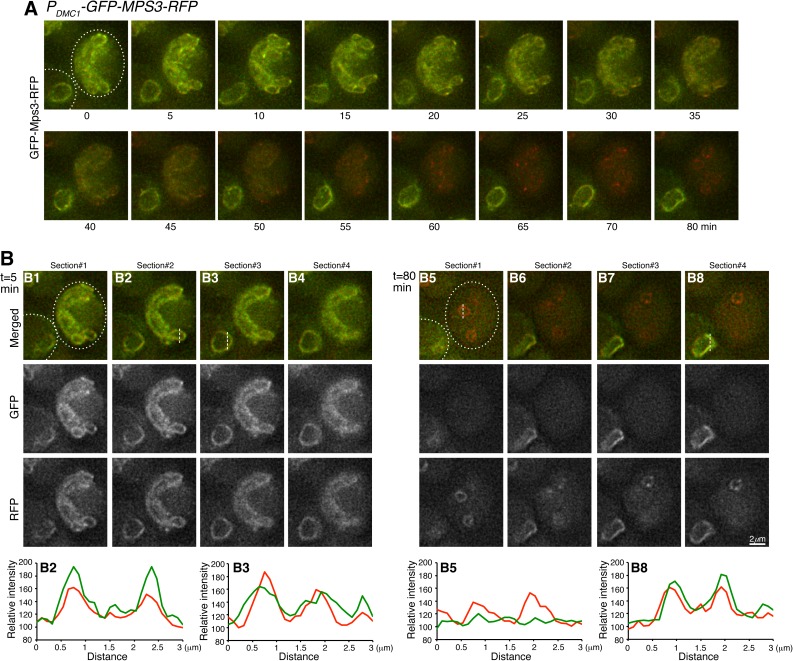
Fig 3. Cytological observation of Mps3 cleavage at the nuclear periphery.
(A) Time-lapse microscopy showing the cell to the right of the field progressing through meiosis II. The expression of GFP-MPS3-RFP was under the control of the meiosis specific promoter PDMC1, which moderately overproduced Mps3. Projected images of 12 z-stacks are shown. Note that the right cell gradually lost its GFP signal, whereas much of the RFP signal remained at the nuclear periphery. The cell to the lower left corner remained at prophase I without nuclear division during the entire time course and serves as a control. Dashed lines depict the cell outline. (B) Selected single optical sections from t = 5 min and t = 80 min showing the signals of GFP and RFP from Mps3 as shown in panel A. Fluorescence intensity of line scans was plotted in the corresponding graphs shown at the bottom. The lower left cell (B3 and B8) serves as a control. Red, RFP; Green, GFP. Strain HY4835.

