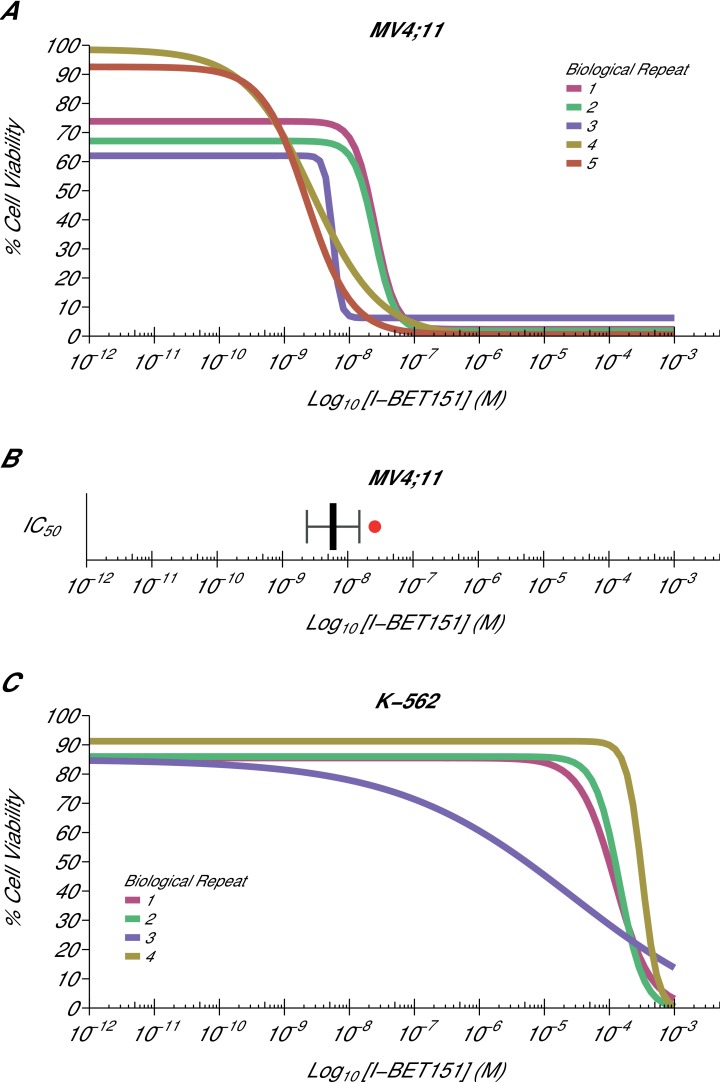
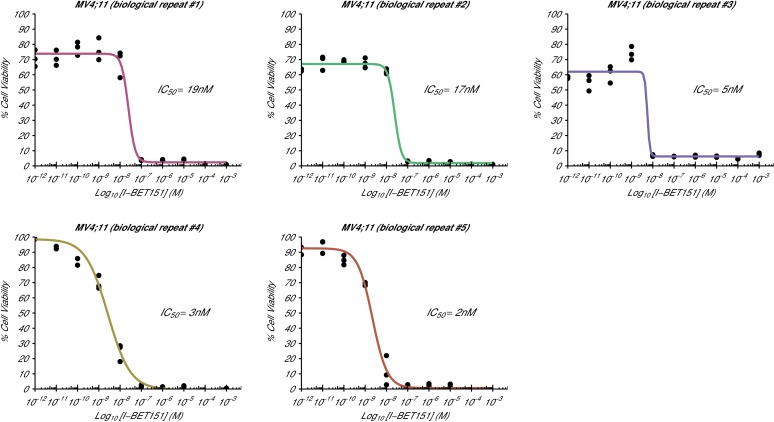
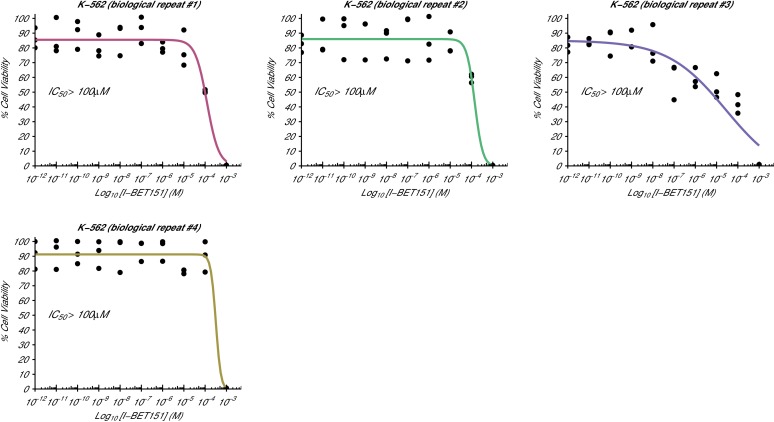
Figure 1. Cellular I-BET151 dose response curves in MLL-fusion leukaemia and non-MLL-fusion leukaemia cell lines.
Cell viability assays were performed for a MLL-fusion leukaemia cell line (MV4;11) and a non-MLL-fusion leukaemia cell line (K-562) with the I-BET151 inhibitor. Curves and absolute IC50 values were determined for each biological repeat. (A) Dose response curves for each biological repeat [n = 5] for the MV4;11 cell line. Percent cell viability is relative to DMSO treated cells. I-BET151 doses range from 1 pM to 1 mM. Exploratory one-sample t-test of IC50 values compared to a constant of 100 µM; t(4) = 20.63, p=3.26×10⁻⁵; Cohen’s d = 9.23, 95% CI [3.13, 15.45]. (B) The mean absolute IC50 value for MV4;11 cells and 95% confidence interval [n = 5] for this replication attempt is plotted with the IC50 value reported in Dawson et al. (2011) displayed as a single point (red circle) for comparison. (C) Dose response curves for each biological repeat [n = 4] for the K-562 cell line. Percent cell viability is relative to DMSO treated cells with I-BET151 dose range from 1 pM to 1 mM. The IC50 estimates were not able to be accurately determined following published guidelines (Sebaugh, 2011). Additional details for this experiment can be found at https://osf.io/zm3j4/.


