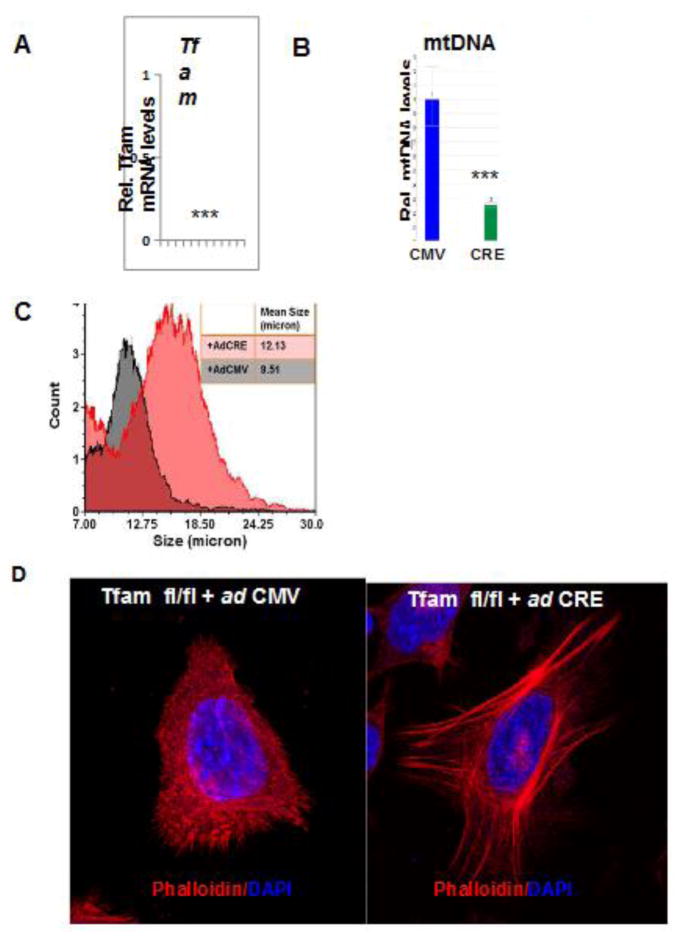
Figure 6. Alterations in cellular morphology in Tfamfl/fl/Cre-primary esophageal cells.
Real Time PCR quantitation of relative Tfam mRNA levels (A) and mtDNA content (B) in primary esophageal epithelial cells derived from Tfam fl/fl mice expressing either Adeno GFP (control) or AdenoL2- Cre (Tfam KO). (C) Cell Size distribution in primary esophageal epithelial cells derived from Tfam fl/fl mice expressing either Adeno GFP (control) or AdenoL2- Cre (Tfam KO) assessed on Nexcelom Vision CBA. (D) Primary esophageal epithelial cells derived from Tfam fl/fl mice expressing either Adeno GFP (control) or AdenoL2- Cre (Tfam KO) stained with Texas-Red Phalloidin (red, actin) and DAPI (blue, nuclei) imaged under 40x objective of a NIKON E600 microscope.

