Figure 4.

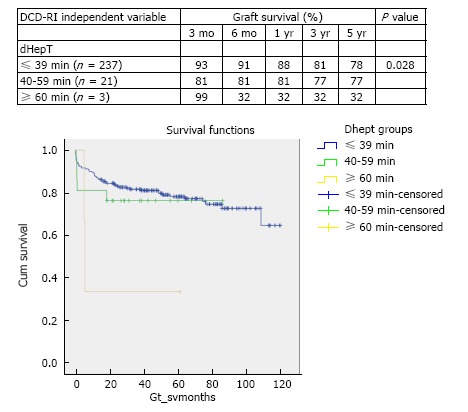
Stratified Kaplan-Meier curves for the cumulative DCD graft survival in relation to DCD donor hepatectomy time (dHepT) and respective 3 mo, 6 mo, 1 year, 3 years and 5 years survival rates (χ2 4.8 Log-Rank, P = 0.028).

Stratified Kaplan-Meier curves for the cumulative DCD graft survival in relation to DCD donor hepatectomy time (dHepT) and respective 3 mo, 6 mo, 1 year, 3 years and 5 years survival rates (χ2 4.8 Log-Rank, P = 0.028).